Simplify PPC management
Learn moreMobile users and desktop users behave differently. They are often looking to accomplish different tasks based upon the device type. Therefore you should test ads differently based upon the user’s device.
However, first we should examine the concept of ‘effective device’ so you understand where your ads are really showing.
With Google and Bing, you can designate an ad as ‘mobile preferred’.
However, that ad might not only be on mobile devices based upon the other ads in an ad group. For instance, if you only have mobile preferred ads in an ad group; then those ads are displayed on desktops and tablets.
If your ad group only contains desktop ads and your campaign is showing on all devices, then your desktop ads are effectively ‘all devices’. This leads us to an important concept: effective device for ads.
There are three possibilities for effective device:
I do use the word ‘mostly showing’ on purpose as it’s possible due to various technology reasons that your mobile ad might show on a desktop or vice versa. This doesn’t happen often, but it does on occasion.
Therefore, to control ad serving by device you need at least one desktop and one mobile device ad in an ad group. To test by device, then you need at least two desktop and two mobile preferred ads in an ad group.
There is not an easy way in AdWords to determine what devices your ads are running on nor to determine if you are testing your ads by device.
The easiest way to get started in understanding this information is to follow these steps:
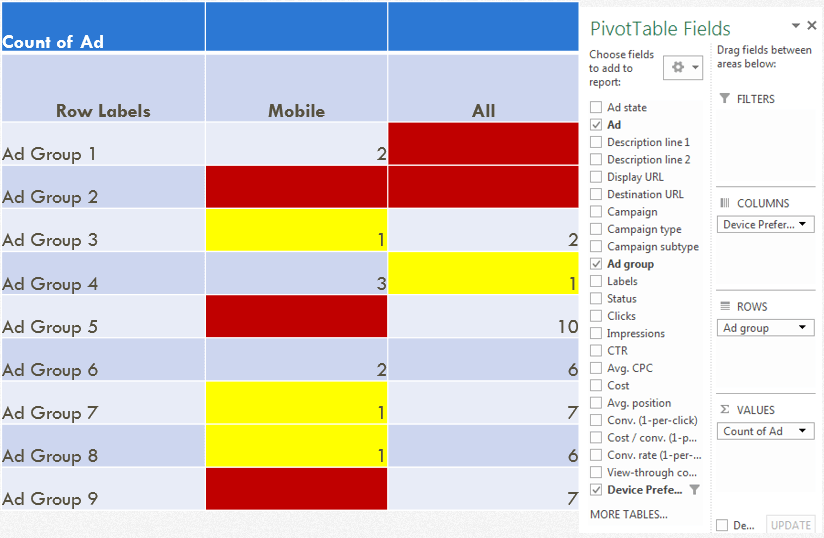
Now, that will just give you a bunch of numbers that are hard to read; so to make the pivot table visual, add conditional formatting to the pivot table:
The legend of effective device:
The legend for testing:
There are two places where you will want to sort to determine where to create ads:
The easiest way to do these sorts is to:
That will ensure that you have desktop ads in all your ad groups. Now repeat the process filtering by the mobile column by ‘red’ or zero mobile ads.
Once you have at least one ad by device type by ad group; then you are controlling ad serving by device.
Next, you will want to repeat these steps for the columns that are yellow so you can make sure you are testing your top ad groups for each device.
This process will give you a snapshot of your ad and testing information in the account at the moment you created and analyzed the pivot table. However, it won’t give you this information automatically until you create the table and analysis again. In addition, just because you are testing doesn’t mean you are declaring winners.
If you want to easily:
Then please take a look at Adalysis.com which will make this processes simple and automated.
Impression Share can be used as a diagnostic tool, along with other analyses, to determine the steps you need to…
Target and Max CPA/ROAS bidding are the most common automated bid solutions used by Google Ads accounts. There are some…
It's that time of the year when we start thinking about what's coming next. While making predictions for the upcoming…
SMX Next is fast approaching, and best of all - it is free! Brad will be speaking in the session:…
Most of the time, accounts that are using smart bidding (i.e. automated bidding) ignore bid adjustment since most of them…
Target and Max bidding are separated by a single checkbox. However, the implications of that single check can be quite…