Ad Testing Guide
RSAs changed ad testing for good. Google assembles your ads, so it’s tempting to load your assets and let the algorithm sort it out.
But if you load 15 headlines and four descriptions, Google Ads has over 50,000 combinations to work with. With 10,000 impressions per month, it would take over 41 years to reach statistical significance.
This guide walks you through how to set up better PPC ad tests. You’ll learn how to build a hypothesis, choose single or multi-ad group testing, test RSAs properly, pick the right winner metric, and avoid common testing mistakes.
The result: better ad copy, cleaner decisions, and results you can trust.
Creating your ad testing hypothesis
Every good ad test starts with a hypothesis.
The hypothesis usually comes from an idea you have and something you want to learn about your customers.
For instance, you might want to try a 10% discount. However, when you sell at a discount, you need to make up for it with more orders. So your hypothesis could be:
We believe that adding a 10% discount will increase conversion rates by 15% and the net revenue increase will be greater than $10,000. To test this, we will start off by offering a discount on a limited selection of products and echo the discount in the ads and landing pages.
The hypothesis could also come from a business milestone:
We’ve now sold more than 1 million tickets. We want to test if this boosts our credibility by adding “more than 1 million tickets sold” to our ads. Will it perform better than our current call to action “call for quick, personal assistance”?
Here are some more ideas to get you started:
- Prices vs discounts
- Geography vs non-geography
- Call to action vs benefits
- Different benefit statements
- Large selection vs custom products
- Pre-qualifications for B2B traffic
- Business credibility vs easy-to-accomplish
- Keyword insertion vs static lines
- Ad customizers vs static lines
- Ad customizers vs other ad customizers
- Countdowns vs limited availability
Once you’ve determined what to test, the next step is deciding the scale of the test.
Single vs multi-ad group testing
Next, you need to decide the scale of the test. That brings us to the two types of ad testing:
- Single ad group testing
- Multi-ad group testing
With single ad group testing, you review the data for only that ad group. Even if you’re testing in thousands of ad groups, you’ll look at each one individually.
With multi-ad group testing, you review the data at the hypothesis level. You’ll look at an ad line, template, label, or pattern, across all the ad groups you’re testing in.
Consider how you’ll apply the insights from your ad tests and where you can use that data in your account.
For instance, with a single ad group test, you’ll learn the best ad for the targeting in that ad group. (Targeting can be keywords, lists, placements, etc.) However, you won’t know if that ad will perform well in another ad group.
With a multi-ad group test, you’ll learn which ad line or concept works best across all the ad groups tested.
When to use single ad group testing
Advantages:
- Best for high traffic ad groups
- Best for brand ad groups
- Easy to get started — you just need multiple ads per ad group
Disadvantages:
- Insights only for a single ad group
- You need a fair amount of traffic to reach minimum data requirements
When to use multi-ad group testing
Advantages:
- Best for templated ads
- Best for small data accounts (since you are combining data at the test level, even small accounts can benefit from ad testing)
- Best for market research and testing hypotheses
- Best for very large accounts
Disadvantages:
- You’ll identify a global winner, but some ad groups might still perform better with a different idea
- Not good for most brand terms, as you want the best brand ad possible and not an overall idea winner
- Can be difficult to set up and measure without the correct tools
Once you’ve determined your hypothesis and scale, the next step is to choose your test metrics.
You can manage both testing methods in Adalysis. Automatically track tests within individual ad groups or combine data across multiple ad groups to see which messages perform best at scale.
RSA testing
Pinning RSA assets
The maximum number of RSA assets creates more than 50,000 different combinations. Unless your ad group receives millions of impressions each month, the algorithms have to ‘guess’ at the best ad combinations. They can’t fully rely on machine learning because there isn’t enough data.
Pinning assets will lower the possible ad combinations. This gives you more control over how your ads are displayed. At the same time, it also increases data density for machine learning.
RSA ad strength
Ad strength reflects the range of assets Google can use to create different ad combinations. Pinning assets lowers Google’s ad serving control, as well as your ad strength.
Ad strength isn’t related to your metrics or quality score. The only time ad strength matters is when an ad group has at least two RSAs. Then, the higher ad strength ad usually receives more impressions.
As ad strength has little impact on your account’s goals, it can be largely ignored.
RSA testing workflows
Ad testing has always been an essential part of PPC management. RSAs haven’t replaced the need for this activity. Here are some ways you can test your ads to improve your account’s effectiveness.
Improve the performance of one unpinned RSA
This is also known as a fully pinned vs. unpinned ad test.
An unpinned RSA will show in many combinations. Some combinations will have good results, and others won’t. However, Google doesn’t give you stats by ad combination to review performance.
Here are the steps to see how an individual combination performs versus your RSA.
- Create a new RSA with the assets of your combination with the most impressions
- Pin each headline to the appropriate position
- Run the ad test
Once you’ve reached statistical significance, you can analyze the data. See if you should use more pinning or remove poorly performing assets.
Test a set of specific messages vs. the algorithm
This is also known as an unpinned vs. partially or fully pinned ad test.
This test is for when you have a specific headline that you want to compare against Google’s algorithm.
- Create another RSA in the ad group
- The new RSA should have at least one headline pinned
- It can have more than one asset pinned to any headline
- Multiple headlines can have assets pinned to them
- Run the ad test
This test will show you how your specific headlines performed versus Google’s algorithm.
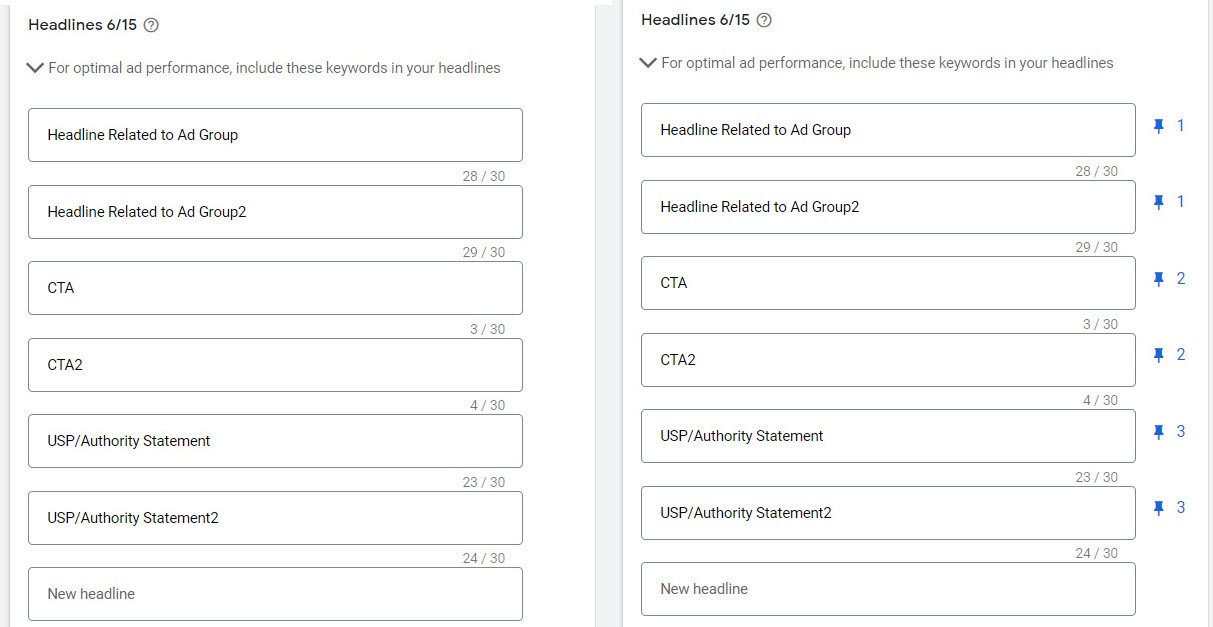
Test multiple sets of specific messages or themes
These are also known as partially or fully pinned vs. partially or fully pinned ad tests.
If you’re a good copywriter, you can usually produce better ad copy than machine learning. This test is also good if you prefer the control that ETAs offered.
To create this test, follow these steps:
- Create an RSA
- Pin at least 1 asset to each headline
- You may pin 2-3 assets for each headline
- Create a second RSA
- Pin at least 1 asset to each headline
- You may pin 2-3 assets for each headline
Often, each of these RSAs will have a different theme. One may focus on calls to action and another on authority statements. Or prices versus discounts.
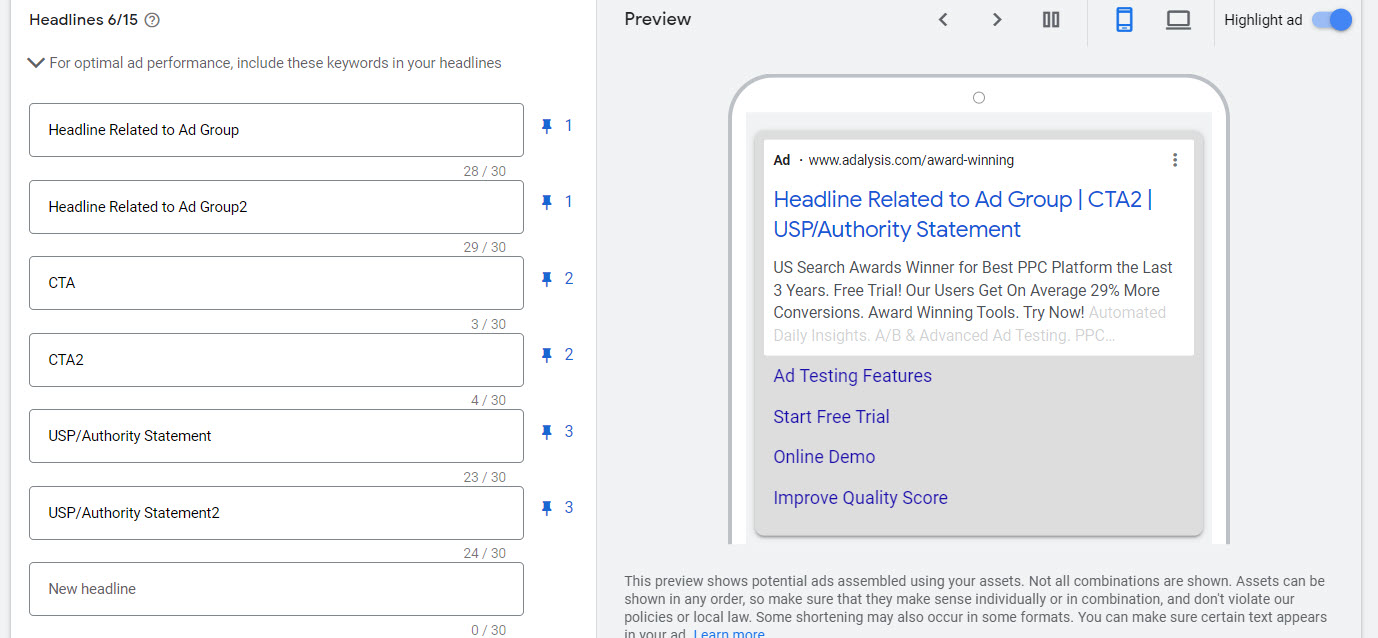
This method allows you to use some machine learning, as you can have multiple assets for each headline. You’re also lowering the total combinations possible, giving the machine more data to work with.
To only test the theme and let machine learning manage the ad combinations, pin 1-3 headlines to a specific position in multiple RSAs.
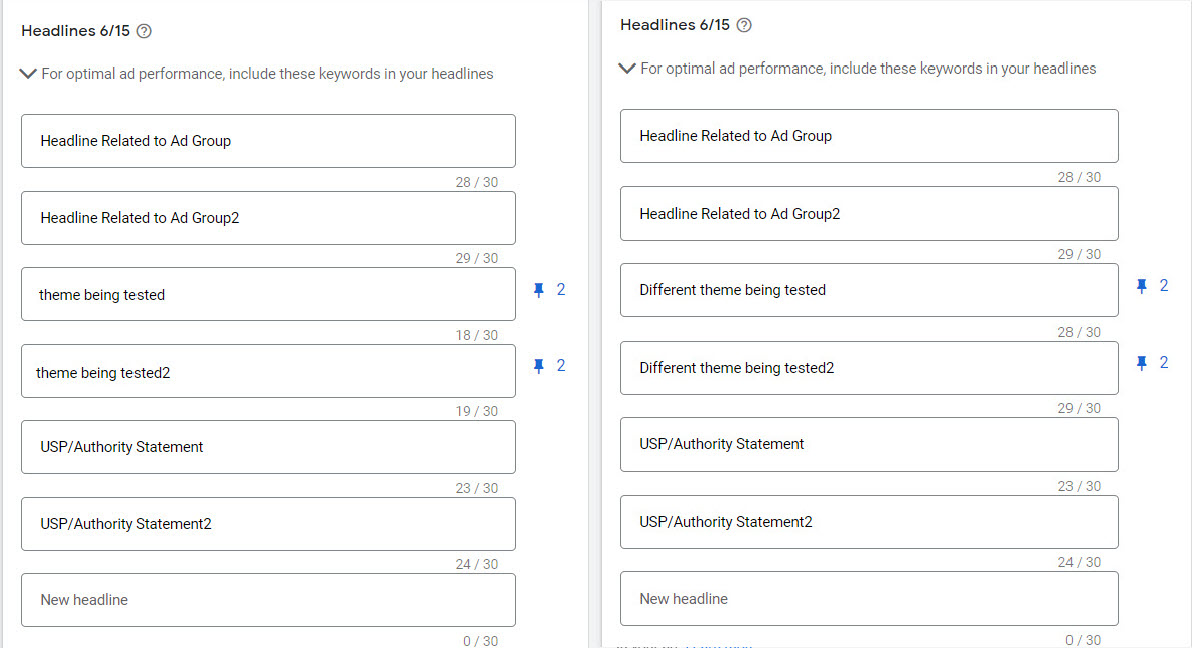
Once you’ve reached statistical significance, you can pause the loser ad. See which combination or theme produced the best results for your account.
Testing Google’s RSA ad serving
You can also test RSAs by creating 2-3 unpinned RSAs in an ad group and letting Google serve the ads as they like.
With this method, it’s best if you have hundreds of thousands of impressions in your ad group each month.
A fully unpinned RSA can have more than 50,000 combinations. Three unpinned RSAs in an ad group means there are more than 150,000 possible ways Google can serve your ads.
Without a very high amount of impressions, machine learning will never have enough data for a reliable test.
If you do have that many impressions, you can use this method to test RSAs and pause your losers as they’re flagged.
Multi-ad group testing
To test two themes across multiple ad groups, you can label the RSAs within each ad group by theme.
For instance, you may want to test authority statements versus calls to action in your headline 2s. Add a different label to each ad based on that theme in every ad group you’re testing. You can then aggregate the data for each label to understand how the two themes compare.
The new multi-ad group RSA testing tools in Adalysis help you run this workflow without manually labeling, combining, and analyzing the data yourself. Set up tests across multiple ad groups, compare themes using impression-weighted aggregate data, and apply the winning ads in bulk.
Try multi-ad group RSA testing with a free 30-day Adalysis trial.
Test metrics overview
Once you’ve chosen your hypothesis and scale, you’ll need to decide how to pick winning ads.
We’ll briefly walk through the metrics here. There is also a detailed breakdown later in this guide.
We recommend that most advertisers use impression-based metrics.
There are six main ad test metrics you can use to find winners. However, each one has pros and cons. It’s important to understand what each one means and how to use it.
Click-through rate (CTR)
CTR is the ratio of clicks to impressions. Using this metric ensures that you receive the most clicks possible.
Advantages:
- Achieve the most possible traffic
- Increase quality score
Disadvantages:
- Doesn’t consider revenue (ROAS)
- Doesn’t consider conversions (CR, CPA)
Conversion rate (CR)
Conversion rate is the ratio of conversions to clicks. This metric ensures you receive the most conversions possible for the clicks you receive.
Advantages:
- Get the most conversions possible when you get clicks
Disadvantages:
- Doesn’t consider the volume of clicks (CTR)
- Doesn’t consider the cost of a conversion (CPA)
- Doesn’t consider actual revenue (ROAS)
- If you have multiple conversion types, you need to calculate the conversion rate for each one (contacts, expensive purchases, cheap purchases, calls, etc)
Cost per acquisition (CPA)
Cost per acquisition is the ratio of spend to conversions. This metric is simply how much you paid to get a conversion.
Advantages:
- Controls how much you pay for a conversion
- Ensures a conversion doesn’t cost more than its generated revenue
Disadvantages:
- Doesn’t consider the volume of conversions (conversion rate)
- Doesn’t consider the volume of clicks (CTR)
- Doesn’t consider actual revenue (ROAS)
- If you have multiple conversion types, you need to calculate the CPA for each one (contacts, expensive purchases, cheap purchases, calls, etc)
Conversions per impression (CPI)
Conversions per impression is the ratio between conversions and impressions. It ensures you get the most conversions possible for the impressions you receive.
Advantages:
- The best metric when you want to base winners on both CTR and conversion rate
Disadvantages:
- Doesn’t consider the cost per conversion (CPA)
- Doesn’t consider actual revenue (ROAS)
Return on ad spend (ROAS)
ROAS is the ratio of revenue to spend. It ensures that you maintain minimum margin on your sales. It’s most commonly used for ecommerce sites.
Advantages:
- Takes actual revenue and costs into account
Disadvantages:
- Doesn’t consider the volume of conversions (conversion rate)
- Doesn’t consider actual traffic (CTR)
Revenue per impression (RPI)
Revenue per impression is the ratio of revenue to impressions. It ensures you receive the most revenue possible for the impressions you receive. It’s most commonly used for ecommerce sites.
Advantages:
- Considers revenue (ROAS) and volume (CTR)
- Great for maximizing the revenue possible from an account
Disadvantages:
- Doesn’t consider the volume of conversions (conversion rate)
- Doesn’t always lead to the highest ROAS possible
When to combine metrics
There are many times when combining two metrics will help you ensure your ad testing is achieving your goals.
For instance, you have an ecommerce account with this goal:
Maximize revenue with a 400% ROAS target
In this case, you need two metrics to determine ad test winners:
- The ROAS of each ad — eliminate any ad under 400%
- For the remaining ads, choose the highest RPI (revenue per impression)
That simple process will make sure that you achieve your goal of maximizing revenue within your target ROAS.
Choose how you pick winners before you start a test, so you know what metrics to monitor.
Test metrics in detail: Click-through rate (CTR)
What is CTR?
CTR is simply the ratio of clicks to impressions.
It’s the metric Google pushes you to use the most, as their ad rotation default is set to optimize for clicks. And it’s useful for ad testing when you want to increase traffic or visitors.
However, CTR doesn’t take into account conversions or revenue goals. That means it’s often not great for sites trying to gain new customers from PPC advertising.
How is CTR calculated?
CTR is calculated by dividing the number of clicks by your impressions:
CTR = clicks/impressions
It’s generally displayed as a percentage. Here are some examples:
| Ad | Clicks | Impressions | CTR |
| 1 | 45 | 243 | 18.52% |
| 2 | 97 | 1023 | 9.48% |
| 3 | 56 | 840 | 6.67% |
| 4 | 32 | 230 | 13.91% |
In this case, ad 1 has the highest CTR and ad 3 has the lowest CTR.
Advantages
There are two main reasons to use CTR:
- Getting the most traffic possible
- Increasing quality scores
If your goal is more traffic, then CTR is the best metric for testing. It’s a common metric for brand departments, who want to make sure that people are seeing their offer. Many companies use CTR for branded keywords and another metric for other keywords.
If you’re struggling with quality score, then using CTR can often help. Expected CTR is an important factor in quality score. So, high CTRs often correlate to higher quality scores, as well as lower CPCs. We often see accounts with a direct correlation between CTR and quality score.
For instance, this chart shows quality score ranges and CTR for one account:
| Quality score | Clicks | Impressions | CTR |
| 1 | 0 | 0 | 0% |
| 2 | 1 | 143 | 0.70% |
| 3 | 21 | 3094 | 0.68% |
| 4 | 1036 | 164,582 | 0.63% |
| 5 | 471 | 23,289 | 2.02% |
| 6 | 7563 | 353,377 | 2.14% |
| 7 | 59,593 | 1,530,468 | 3.89% |
| 8 | 68,153 | 1,435,300 | 4.78% |
| 9 | 93,640 | 1,329,169 | 7.05% |
| 10 | 131,586 | 1,472,395 | 9.62% |
| Totals | 372,064 | 6,301,816 | 5.90% |
Disadvantages
CTR doesn’t discriminate between good or bad traffic.
If you have a high CTR and a very high bounce rate, then you’re attracting traffic that isn’t responding to your message. Therefore, even when you want the most traffic possible, it’s best to use interaction goals to safeguard quality. Interaction goals can include page views per visit or time on site.
That means CPI (conversions per impression) is often a better metric than CTR if your goal is high quality traffic. With CPI, you can set a goal based on quality visits. Then, optimize your ads to attract the most qualified visitors.
Raising CTRs to increase quality scores is good for most but not all companies. For B2B accounts, it’s common to add qualifications to ads, such as “for businesses” or “industrial”.
If you remove the qualification, then your CTR and quality score will often increase. This may be to the detriment of your overall goals, as lead quality may suffer.
CTR is also useful when combined with other metrics as a tie breaker. You may have two ads with identical results (such as CPI, CPA, CR, ROAS). Choosing the higher CTR ad will generally result in higher quality scores, slightly higher positions or lower costs.
When to use CTR as a test metric
CTR is important. Without clicks, you won’t receive conversions and the other metrics are moot. However, it’s rarely a metric you will use by itself in your testing.
- Use CTR for raising quality scores and as a tie breaker.
- Don’t use CTR for conversions or traffic quality. For traffic, time on site and CPI (conversions per impression) works better.
Test metrics in detail: Conversion rate (CR)
What is conversion rate?
Conversion rate (CR) is simply the ratio of conversions to clicks. The higher your conversion rate, the more conversions you have once someone clicks on your ad.
Conversion rate is a common test metric. The biggest downside is that it doesn’t take into account how many clicks your ad actually receives.
How is conversion rate calculated?
Conversion rate is calculated by dividing the number of conversions by your clicks:
Conversion rate = conversions/clicks
It’s generally displayed as a percentage. Here are some examples:
| Ad | Conversions | Clicks | CR |
| 1 | 1 | 100 | 1% |
| 2 | 10 | 100 | 10% |
| 3 | 32 | 1045 | 3.06% |
| 4 | 57 | 1103 | 5.17% |
In this case, ad 2 has the highest conversion rate and ad 1 has the lowest.
Advantages
There are two main reasons to use CR:
- Using ads to test landing pages
- Getting the most conversions possible once someone clicks
A common landing page test is to create two identical ads in an ad group, except for the destination URL. Ad 1 goes to landing page 1 and ad 2 goes to landing page 2.
If you’re testing page templates, you can duplicate this test across several ad groups. Then, use multi-ad group testing to aggregate the results.
You can also use conversion rate as a test metric to maximize conversions. However, this has an inherent weakness: it doesn’t consider the volume of clicks.
Disadvantages
Conversion rate isn’t always a good metric for increasing conversions from your ads. Consider these stats:
| Ad | Impressions | Clicks | Conversions | Cost | CTR | Conv rate | CPA |
| 1 | 1000 | 100 | 10 | $200 | 10% | 10% | $20 |
| 2 | 1000 | 10 | 2 | $25 | 1% | 20% | $12.50 |
| 3 | 1000 | 56 | 5 | $126 | 5.6% | 8.93% | $25.20 |
| 4 | 1000 | 11 | 4 | $33 | 1.1% | 36.36% | $8.25 |
| 5 | 1000 | 156 | 12 | $234 | 15.6% | 7.69% | $19.50 |
In every case, the ads all received the exact same impressions. Because CTR varies, so will the actual CPC and costs for each ad variation.
The ad with the highest conversion rate is ad test 4 at 36.36%. However, that ad only received a total of 4 conversions. The ad with the lowest conversion rate, test 5, received three times as many conversions at 12.
Ad 5 had such a high CTR, so it received more traffic and opportunities to create conversions than the other ads. Even though it’s the lowest conversion rate, it ends up with the most conversions.
For landing page tests, conversion rate works well. The page itself doesn’t attract more or fewer clicks. It only considers the users who actually reached your page.
When to use conversion rate as a test metric
Conversion rate is your go-to ad test metric when you’re testing landing pages and not the ads. If your ads are identical and you’re just testing landing pages, then conversion rate will be your primary metric in your testing.
Since conversion rate doesn’t consider click volume, it’s not a great ad test metric by itself. However, combined with CTR it creates CPI (conversions per impression). We’ll come back to this later in the guide.
Test metrics in detail: Cost per acquisition (CPA)
What is CPA (cost per acquisition)?
CPA is simply how much a conversion costs you.
It’s often called cost per conversion. However, we usually associate the acronym CPC with cost per click in PPC. We often hear people say ‘cost per conversion or CPA’ to avoid confusion.
CPA is a common test metric in a few types of accounts:
- Lead generation
- eCommerce when checkout amounts greatly vary
- eCommerce when the checkout amount is always the same
- Subscription sites
It’s particularly suited to these examples of business models:
- Reselling leads without paying more to acquire a lead than it can be sold for
- Long sales cycle using early funnel proxies to final conversion numbers
- A single product (all checkouts are equal)
- A recurring subscription fee that’s fixed each month
Some ecommerce accounts have checkouts that are highly variable. When ROAS (return on ad spend) doesn’t work as a test method, CPA is a good substitute.
For instance, an ecommerce company has an average checkout of roughly $500. However, 5% of their checkouts are for more than $10,000. The keyword and ad that receives those high value checkouts are completely random.
If they apply ROAS as a bid strategy or test method, the outliers would lead to them picking an ad winner that might not have the same value the following month. CPA is a better metric for them to use for testing and bid management.
CPA is also a great combination metric and we’ll address that later in this guide.
How is CPA calculated?
CPA is calculated by dividing total cost by total conversions.
CPA = cost / conversions
It’s generally displayed as a currency amount. Here are some examples:
| Ad | Cost | Conversions | CPA |
| 1 | $1,000.00 | 10 | $100.00 |
| 2 | £1,000.00 | 5 | £200.00 |
| 3 | ¥500.00 | 10 | ¥50.00 |
| 4 | € 429.00 | 11 | € 39.00 |
If we don’t correct for currency differences and treat them all as the same currency, then ad 4 would have the lowest CPA and ad 2 would have the highest CPA.
Advantages
The primary advantage of CPA is to control how much a conversion costs you.
For instance, if you’re reselling leads for $25, you might not want to pay more than $15 for a conversion.
With long sales cycles, you’ll often need to consider the whole cycle. For example:
- Buy clicks to site
- Site goal is to collect email address
- If user gives you their email, invite them to a webinar
- If user watches 50% of the webinar, pass their info to the sales team
- Sales team tries to close lead
Let’s assume we spent $10,000 at $1 CPC and see how much it costs to close the lead:
| Conversion rate | People in funnel | CPA | |
| Clicks to site | 10,000 | ||
| Emails collected | 20% | 2,000 | $5 |
| Accept webinar invite | 40% | 800 | $13 |
| Attend webinar | 50% | 400 | $25 |
| Watch 50% of webinar | 50% | 200 | $50 |
| Sales team contact rate | 25% | 50 | $200 |
| Sales team close rate | 20% | 10 | $1000 |
We can now work backwards to determine our initial CPA for email collection. If the cost of $1,000 for a new sale is profitable, we’re in good shape. To increase the people entering the funnel, we can raise the CPA. And if the final cost is low, we can lower the CPA.
In this particular case, there are many things you can test beyond CPA, such as:
- Landing page
- Email invitation
- Webinar sign-up page
- Webinar content
- Sales team contact & follow-up methods
- Sales team script
In other cases, it’s much easier. For instance, if you sell a single digital product for $50, a $40 CPA might be OK, as it will net you a $10 profit per sale.
CPA can be complicated to determine. But it’s a good metric for cost control, by itself or in conjunction with others.
Disadvantages
CPA is great for controlling costs. It isn’t always best for testing, since it doesn’t take into account the volume of clicks or conversion rate.
Consider these stats:
| Ad | Impressions | Clicks | Conversions | Cost | CTR | Conv Rate | CPA |
| 1 | 1000 | 100 | 10 | $200 | 10% | 10% | $20 |
| 2 | 1000 | 10 | 2 | $25 | 1% | 20% | $12.50 |
| 3 | 1000 | 56 | 5 | $126 | 5.6% | 8.93% | $25.20 |
| 4 | 1000 | 11 | 4 | $33 | 1.1% | 36.36% | $8.25 |
| 5 | 1000 | 156 | 12 | $234 | 15.6% | 7.69% | $19.50 |
For these results, each ad was served the same amount of times (1000). The lowest CPA is ad 4 at $8.25; however, it only has 4 conversions. The ad with the most conversions is ad 5 with 12, but its CPA is more than double ad 4.
This is often what you fight with CPA – costs versus volume. This is why CPA works well combined with other metrics.
Combining CPA with other metrics
In many cases, you don’t want the lowest CPA ad. What you want is a CPA threshold and then to pick the ad with the most conversions at or below your target.
For instance, if our max CPA was $20 this would be our process:
- Eliminate ad 3 as its cost is above our target CPA
- Pick the remaining ad with the most conversions, which is ad 5
In the real world, the biggest issue with this process is that your ads won’t all have the same number of impressions. What you’ll need to do is eliminate the ads above your target CPA and then pick the ad with the highest CPI (conversions per impression). That will lead to the most conversions at or below your target CPA.
Sometimes, you’ll have a target CPA, but you want the most visitors to see your offer (landing page) and become familiar with your company. It’s a common scenario for PPC accounts where many searchers will visit the site multiple times before they convert.
In that case, you would use CPA as your filter and CTR as your winning ad metric. This is also useful if you’re trying to raise quality scores with a max CPA. (Higher CTRs usually mean higher quality scores.)
When to use CPA
CPA is a very important metric for most accounts (except some ecommerce sites). It determines how much you pay for a conversion. You can compare the data to your actual revenue and check your account is profitable.
Use CPA as a filter to remove ads that are above your target CPA. Then, use another metric, such as CPI or CTR, to determine the winning ads that are below your target.
Test metrics in detail: Conversions per impression (CPI)
What is CPI (conversions per impression)?
CPI shows how many conversions you receive for each impression. Here’s why it’s useful:
When you consider ad testing, which combination is better?
- A high CTR and a low conversion rate
- Lots of people click on your ads, so your page gets a lot of visibility, but not many of those users convert
- A low CTR and a high conversion rate
- Not many people click on your ads, but of those that do, many of them convert
It’s impossible to say since that information relies on two metrics: CTR and conversion rate.
CPI combines these metrics to show you which ad will receive the most conversions from each impression.
How is CPI calculated?
CPI is calculated by dividing total conversions by total impressions.
CPI = conversions / impressions
It’s generally displayed as a percentage. Here are some examples:
| Ad | Impressions | Conversions | CPI |
| 1 | 10,000 | 12 | 0.12% |
| 2 | 10,000 | 5 | 0.05% |
| 3 | 10,000 | 15 | 0.15% |
| 4 | 10,000 | 14 | 0.14% |
| 5 | 10,000 | 13 | 0.13% |
| 6 | 10,000 | 10 | 0.10% |
In this example, ad 3 has the highest CPI and ad 2 has the lowest.
Advantages
The main reason to use CPI is when you want the most conversions possible. It’s great for lead generation.
Every time your ad is displayed, you have a chance of a conversion. You picked a keyword. Someone searched for your keyword and could convert.
The user still has to click on your ad and convert, but measuring from the impression shows you the total conversions possible. Because CPI takes into account CTR and conversion rate, it’s a reliable metric for this case.
Working with CPI
When you review the full metrics behind different ads, you might not always pick the highest CPI winners. This usually happens for a few reasons.
- You’re struggling with quality score and you want to pick a high CTR ad with similar total conversions to raise your score.
- In general, the higher the CTR, the higher your quality score.
- You have a strict CPA target and have to pick an ad under your limit.
- You only want a certain number of leads per month, so you pick the ad that can hit your total leads for the lowest cost.
- You want landing page visibility as much as conversions. This is a common branding goal.
- We’d argue CPI is still your best metric to use; you just need to readjust what a conversion is. For instance, a video play or 3 minutes on site could be a conversion. CPI is still your best metric if you pick a ‘good visit’ conversion.
How to pick your winning ad
Let’s take a look at a full chart of data and then examine how we’d pick the winners (click the chart to see a larger version).
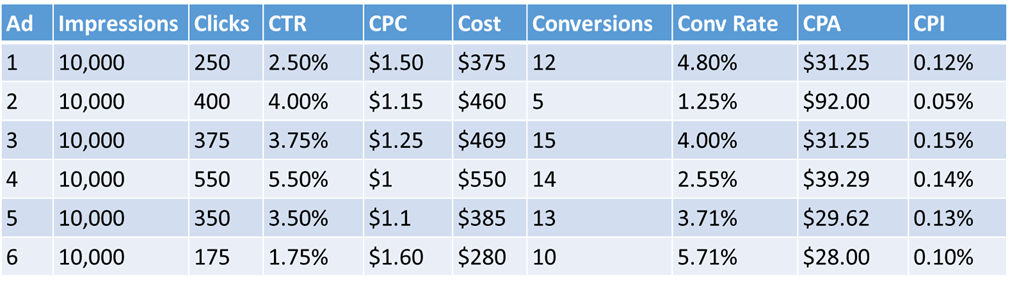
If we just want the most conversions possible, then ad 3 is our clear winner. It receives 15 conversions for every 10,000 impressions. This is why CPI is such a great metric. Ad 3 is not the winner in CTR (that’s ad 4) or the winner in conversion rate (that’s ad 6).
Compared to our other ads, ad 3 has both a good CTR and a good conversion rate, but it’s not a winner or loser in either metric. However, when you combine CTR and conversion rate, then ad 3 is a clear winner.
If we are struggling with quality score, then we might pick ad 4 as it has a much higher CTR than the other ads. This is also why it has a lower CPC than the other ads, and its CPI isn’t too far behind our winner.
Let’s say our goal is a $30 CPA and we want the most conversions under $30. We’d eliminate all the ads with a CPA higher than $30. We’d then pick the highest CPI ad from the ones that are left as our winner, which is ad 5.
If we only wanted 10 leads a month and to pay as little as possible for each one, then ad 6 would be our winner. It has the lowest CPA and can reach 10 conversions per month (assuming this was monthly ad data).
Using our data to plan our next ad tests
Assuming we want the most conversions possible (or even the most under $32 CPA), then ad 3 is our clear winner. However, we should learn from the other ads in our next set of ad tests. This is where examining ads that lost in your overall metric but won in a single metric is useful.
For instance, ad 4 is a clear CTR winner. Why? Was there a line in the ad that was very attractive to users? We might want to use that line for our next ad test. We could duplicate ad 3, add that line, and then run another test.
Why did ad 6 have such a great conversion rate? It did have a very low CTR. Odds are, this ad was pre-qualifying users with ad text that was meant to filter out users. We could look at what that qualification is, use it in a new ad 3 duplicate, and test that combination.
Finally, ad 2 was a conversion rate failure. Why? We might want to add a note about a line to avoid as this ad clearly attracted the wrong types of clicks.
Disadvantages
CPI doesn’t consider revenue or total order amounts. For ecommerce sites that want to base conversions on ROAS or revenue targets, CPI isn’t the best choice.
However, there are other metrics, such as ROAS or RPI/PPI (revenue/profit per impression) that are better suited for ecommerce. We’ll cover these metrics later.
When to use CPI
CPI is one of the best ad test metrics when your goal is to maximize conversions. By combining CTR and conversion rate into a single metric, it shows which ads create the most conversions from their impressions.
It’s great for lead generation, but less suitable for ecommerce companies.
If you have a target CPA, use CPA as a filter first. Remove any ads above your threshold and then choose the highest CPI ad from the remaining options.
If revenue isn’t part of your test criteria, CPI should almost always be part of how you evaluate ad winners.
Explainer: ROAS, ROI & conv. value/cost
The next two metrics we need to discuss, ROAS and RPI (revenue per impression) rely on tracking revenue.
There’s a lot of confusion about ROAS, ROI, and Google’s conv. value/cost metric. So before we continue, let’s define these metrics properly.
The history of ROI vs ROAS in Search marketing
Return on investment (ROI) has been long misused in Search.
The true formula is ROI = (revenue – cost) / (cost).
Many marketers instead use ROI = (revenue) / (cost), which isn’t correct. This is because ROI can be a negative number, and negative numbers make bid calculations more complex.
In the incorrect formula, a 100% ROI is your breakeven point (assuming you aren’t taking the cost of hard goods into account). That makes for easy calculations. The simple explanation is that since you’re calculating marketing costs, you just remove them from the formula to work out ROI.
In the early years, search marketing was often run by non-marketers, like web designers or IT departments. The slight change in definition often didn’t matter to the company.
However, Search has grown into a multi billion-dollar business and is being taught in college marketing classes. An effort must be made to correct the use of these terms so that it’s consistent between company departments.
The ROAS formula is ROAS = revenue / advertising cost. It’s the same as the incorrect ROI formula used by many search marketers.
While this difference doesn’t matter to everyone, if you ever run into a CFO auditing your numbers, they’ll care quite a bit about the difference in ROI vs ROAS.
ROAS vs ROI example
Let’s take a simplistic look at the difference between ROI and ROAS.
| Campaign | PPC Cost | Revenue | ROAS | ROI |
| 1 | $1000 | $2000 | 200% | 100% |
| 2 | $1000 | $1000 | 100% | 0% |
| 3 | $1000 | $500 | 50% | -50% |
In this example, for campaign 3 to break even it needs to lower its bids by 50%.
By using ROAS as our bid multiplier, it’s easy math to do in Excel since ROAS is always a positive number (or 0). This is why most marketers use ROAS to set bids.
Since ROI can be positive or negative, you need to build a more complex formula to calculate your bids. In the end, the answer is the same: reduce your bids by 50% to break even.
This is why most PPC marketers actually use ROAS even if they say they’re using ROI. Of course, it isn’t everyone. Many people know the difference and calculate these numbers correctly. However, it seems like at every PPC conference, at least one speaker talks about ROI wrongly.
ROAS isn’t always ROAS
ROAS is a good metric to work with if you’re:
- Ignoring hard costs such as salaries and manufacturing
- Selling digital goods
However, if you are selling physical goods, start by removing the cost of those goods from your revenue. Then, calculate bids and determine ad test winners.
Please note, this cost of physical goods includes all hard costs. If you’re selling hosting packages, remove your costs for servers, bandwidth, etc.
However, there’s not an easy way to do this in Google Ads. That’s why we’re going to stick to physical goods examples, which can be programmatically accomplished.
Google Ads allows you to pass dynamic variables to your account based upon the sale.
Most advertisers pass along the total sale of goods (excluding shipping) to Google Ads with this feature. In this case, ROAS isn’t true ROAS since the cost of goods isn’t removed before the calculation.
This is why a lot of companies don’t have a 100% breakeven ROAS. They might have a 200% breakeven ROAS target, since they have to accommodate the cost of goods. In these cases, the company might have a 400% ROAS target for the account to be profitable.
Some companies pass the total cost of goods sold minus cost of hard goods to Google Ads. In this case, ROAS really is ROAS (again, assuming you’re only talking goods and no other fixed costs).
Breakeven points
If you’re calculating true ROAS, then a 100% ROAS means breaking even. That means 100% margins or removing the cost of goods before calculations.
A 200% ROAS means for every dollar you spend, you bring in two dollars of revenue. A 50% ROAS means for every dollar you spend, you bring in only 50 cents. In other words, a 50% ROAS means you are losing money.
If you’re selling products and not removing the cost of those products, then a 100% ROAS means that you are losing the cost of the product, and potentially shipping, on each sale.
This is where calculating ROAS and ROI can be even trickier, as we’re making assumptions about the cost of goods and marketing. Some companies calculate revenue and profits by taking out all costs, which can include overhead, salaries, and so forth. So even within a company you might have two different calculations for the same metrics.
Google’s confused too
If you’re passing revenue amounts into Google Ads, then you can see ‘Conv. value/cost’ inside your account.
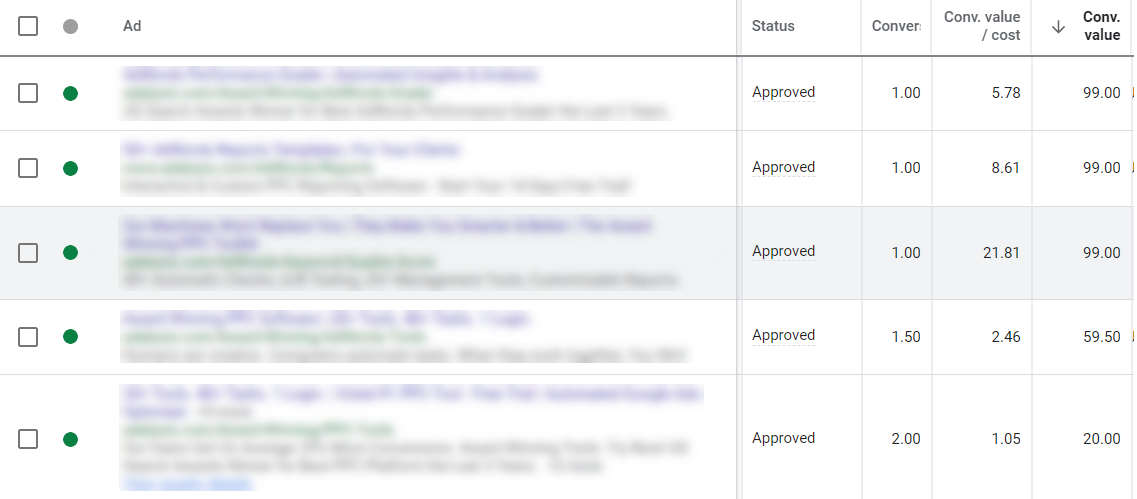
This column is calculated by dividing the total conversion value, which is the total revenue you passed to Google for that data point (i.e ad, keyword, etc) by the cost of those clicks.
Conv. value/cost = Total conversion value/cost
If you hover over the ? icon in Google Ads, you’ll see this tooltip from Google:
Conversion value per cost (“Conv. value/cost”) measures your return on investment. It’s the conversion value divided by the total cost of all ad interactions. The cost in this metric excludes interactions that can’t lead to conversions, such as those that happen when you aren’t using conversion tracking..
Google states that this number is your return on investment (ROI). However, that’s not accurate as the formula is for ROAS, not ROI.
Please note, most people show ROAS and ROI as percentages. Google shows it as a whole number. So a 2750% ROAS appears in Google Ads as 27.5. They’re the same number, displayed differently.
A high ROAS doesn’t always mean more profits
ROAS and ROI are simple ratio metrics. It’s possible for one ad to have a higher ROAS than another, but lower profits.
Here’s a very simplistic look at two ads:
| Ad | Cost | Revenue | ROAS | Profit |
| 1 | 5000 | 10,000 | 2 | 5,000 |
| 2 | 3000 | 7,000 | 2.33 | 4,000 |
In this example, ad 2 has a higher ROAS but lower profits. Ad 1 has a lower ROAS and higher profits.
It’s useful to calculate profits along with ROAS for your campaigns. This is another reason that we like using revenue or profit per impression in our ad testing. We’ll cover that metric in detail later in this guide.
Wrap-up
When you say ROI or ROAS, think back to what math you used. Is it your actual ROAS, your ROI, or a version of ROAS your PPC department uses for bidding?
If your team has a 200% breakeven ROAS target, then you aren’t calculating ROAS. You might internally use the term, but this metric is more akin to cost of revenue calculations (although, that’s not quite right either).
We’re going to discuss how to test by ROAS and Revenue/Profit per impression metrics. These are two great metrics to use for ecommerce accounts. However, we need to first define ROAS and its various permutations before we can easily discuss how to use ROAS and RPI/PPI for testing purposes.
Working with ROAS, ROI & conv. value/cost
ROAS (return on ad spend) and ROI (return on investment) are two common ad test metrics for ecommerce accounts.
If you dynamically pass your conversion values to Google Ads, you’ll have a column known as conv. value/cost in your account. This stands for conversion value/cost.
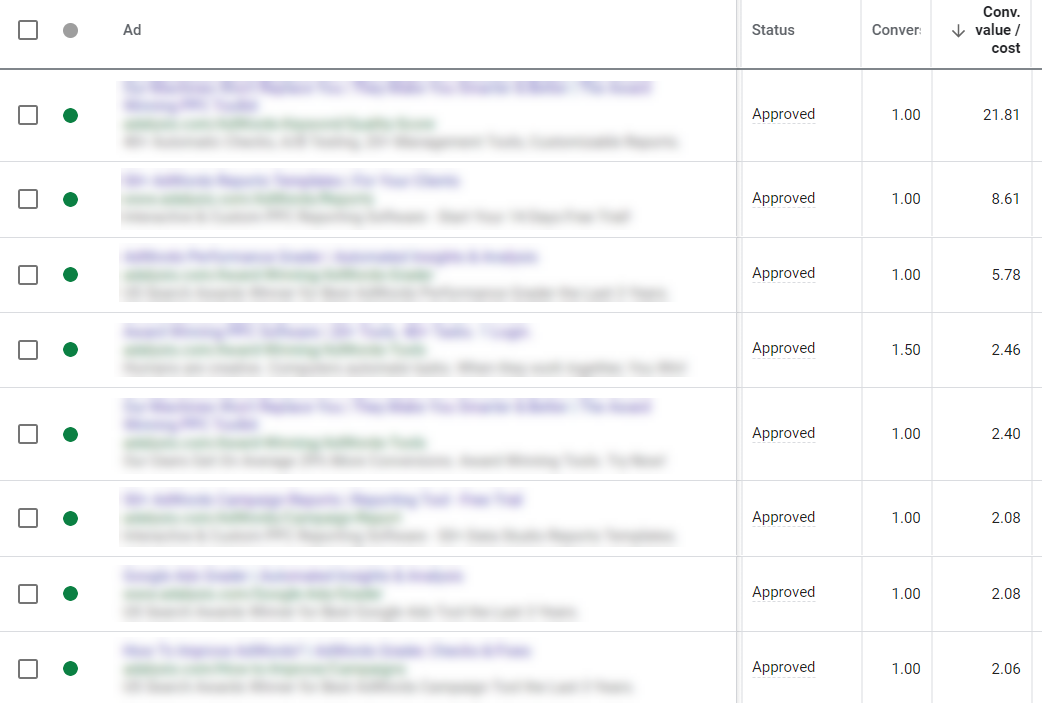
How you pass conversion values to Google Ads determines what conv. value/cost represents. If you send the entire checkout amount (hopefully minus shipping), then this value is usually ROAS. When you pass on the checkout amount minus hard goods, it’s generally ROI.
We’re going to stick to conv. value/cost in this guide, as that’s what you see in your account.
How is conv. value/cost calculated?
Conv. value/cost is calculated exactly how you think it would be. It takes the entire conversion value of a data point, such as an ad, and divides that by the cost of that data point.
Conv. value/cost = total conversion value / cost
While ROAS and ROI are usually expressed as percentages, Google shows this as a whole number. Here are some examples:
| Ad | Conversion value | Cost | Conv. value/ cost |
| 1 | 100 | 300 | 0.3 |
| 2 | 500 | 500 | 1 |
| 3 | 1000 | 700 | 1.4 |
| 4 | 10,000 | 1000 | 10 |
| 5 | 15000 | 3500 | 4.3 |
In this example, ad 4 has the highest conv. value/cost and ad 1 has the lowest.
When to use conv. value/cost
There are two main reasons that companies like to use ROAS as their test metric.
The first is bidding. Many ecommerce companies bid based on ROAS or ROI. Using the same metric for ad testing ensures that tests are in alignment with their bidding goals.
The second reason is that it ensures the account is profitable. Many companies require the account to have a positive ROAS, such as 400%, to make sure it’s making money. Often the targets are inflated, as they might not be removing the cost of goods or other costs. A higher ROAS target or conv. value/cost means they know the account or the ad test is making money.
Disadvantages
The downside of using conv. value/cost as a test metric is that it doesn’t consider volume. For instance, what winner would you pick from this chart?
| Ad | Cost | Conv. value | Conv. value/ cost | Profit (conv. value – cost) |
| 1 | 100 | 1000 | 10.0 | 900 |
| 2 | 1000 | 5000 | 5 | 4000 |
| 3 | 1200 | 1000 | 0.8 | -200 |
| 4 | 800 | 5000 | 6.3 | 4200 |
| 5 | 5000 | 12,000 | 2.4 | 7000 |
If you picked the ad with the highest conv. value/cost, ad 1 at a 10, then you’re only making 900 in profit (assuming there are no other hard costs).
With ad 4, the second highest conv. value/cost, you’d make 4200.
And ad 5, one of the lowest conv value/cost entries, would make 7000.
So while ad 5 is best for the company, the highest conv. value over costs is actually one of the least profitable ads.
Using conv. value/cost as a filter
In many cases, conv. value/cost is based on revenue rather than profit because hard costs aren’t removed. It might just be revenue minus marketing costs. Therefore, you might have a conv. value/cost target of 5 and your breakeven point is 3.
In that case, ad 5 would lose you a lot of money since it’s actually below your breakeven point. Therefore, you have to filter out any keywords below a 3 conv. value/cost and then take the highest profit keyword after the filtering is completed, which would be ad 4.
The other option would be to first remove all hard costs, and then work from profit in picking your ad tests. Just note that the highest conv. value/cost or even highest ROI/ROAS ads might not be the most profitable ones for the company. It happens often when you place emphasis on high volume low margin orders versus lower volume higher margin products.
Regardless, conv. value/cost can be a great filter to remove ads that aren’t hitting your targets. You can then use other metrics to pick the winners.
Wrap-up
Conv. value/cost is a decent test metric if you want to align your bid method to your ad testing.
Just remember that conv. value/cost is a Google Ads metric that could correlate to ROI, ROAS, or even another metric depending on its configuration. Because it’s a ratio of revenue to spend, it doesn’t take profit or volume into account. That’s why it works well as a filter for removing unprofitable ads.
RPI (revenue per impression) is often a better test metric for ecommerce accounts. We’ll cover it in detail in the next section.
Revenue/profit per impression (RPI/PPI)
Revenue per impression (RPI) is sometimes called profit per impression (PPI). It’s a good test metric to use for ecommerce or accounts with variable checkout amounts.
The difference between RPI or PPI doesn’t lie in the calculations. Instead, it’s to do with how you pass data to your Google Ads account and if you use ROAS or ROI, which we’ve previously covered.
For the remainder of this guide, we’re going to be consistent and only use RPI and revenue. However, if you pass revenue data without the cost of goods (or hard costs), then you can substitute profit for revenue throughout this section.
RPI is a metric that shows you the ratio between your impressions and the amount of money you make. It’s similar to conversions per impression (CPI), except with actual revenue and not just conversion data.
When you consider ad testing, which combination is better?
- A high CTR and a low conversion rate
- Lots of people click on your ads, so your page gets a lot of visibility, but not many of those users turn into customers
- A low CTR and a high conversion rate
- Not many people click on your ads, but of those that do, many convert
- A high conversion rate, but the average order is low
- A low conversion rate, but the average order is high
It’s impossible to say since that information relies on three metrics: CTR, conversion rate, and revenue (or RPS, revenue per sale).
When to use conversions instead of revenue
When you have variable checkout amounts, revenue gives you a more accurate picture of how much money you’re making. It also lets you accurately determine ROAS and conv. value/cost. For consistently sold items, this is usually the best metric.
You may have irregular outlier sales that skew the data drastically. In this case, CPI or plain conversion data is better than revenue for testing and management.
For instance, an early ecommerce client makes about 300 sales a month. Their average sale is roughly $500. Of those 300 sales, roughly 10-20 are over $10,000.
The ads and keywords that bring in these sales are never the same month over month. The fact they’ll get a sale from a keyword or ad is predictable, but the sale amount isn’t.
Using revenue for bidding or ad testing is a bad idea since the data won’t be consistent month on month. However, since the sale itself is predictable, they’re best off to use CPI.
Another exception is when you want the most customers possible regardless of their checkout amounts. For instance, if you’re trying to build a customer base, 1000 sales at $10 ($10,000 in revenue) could be better than 500 sales at $30 ($15,000 in revenue). Of course, this isn’t a common scenario.
Outside of these edge cases, if you run an ecommerce business or have variable checkout amounts, using actual revenue lets you optimize your testing toward higher revenue instead of simply generating more conversions.
For most companies, measuring revenue and profit is more important than measuring conversions. Your ads can affect average order value, upsales, cross sales, etc. It’s important to know how much the ads are actually making for you and not just how many conversions they’re bringing in.
How is RPI calculated?
RPI is calculated by dividing total revenue by the total impressions.
RPI = revenue / impressions
It’s generally displayed as a currency amount. Here are some examples:
| Ad | Impressions | Conversions | Revenue | Average sale amount | RPI |
| 1 | 10,000 | 12 | 1200 | 100 | 0.12 |
| 2 | 10,000 | 5 | 2500 | 500 | 0.25 |
| 3 | 10,000 | 15 | 1500 | 100 | 0.14 |
| 4 | 10,000 | 14 | 8400 | 600 | 0.84 |
| 5 | 10,000 | 13 | 7200 | 900 | 0.72 |
| 6 | 10,000 | 10 | 500 | 50 | 0.05 |
To make this an easy illustration, we used the exact same number of impressions for every ad. In reality, this is rarely the case. However, it means that the highest revenue ad (4) has the highest RPI (0.84).
Ad 3 has the highest ratio of conversions and ad 5 has the highest average sale amount. However, ad 4 has the highest revenue per impression. That means when ad 4 is displayed, you make more money than with any other ad.
Advantages
The main reason to use RPI is when you want the most revenue possible.
Every time your ad is displayed, you have a chance of a conversion. You picked a keyword. Someone searched for your keyword and could convert.
The user still has to click on your ad and convert, but measuring from the impression shows you the total revenue possible. Because RPI takes into account CTR and actual revenue, it’s a reliable metric for this case.
Working with RPI
When you review your ads’ metrics, you might not always pick the RPI winners. This usually happens for a few reasons.
- You’re struggling with quality score, and you want to pick a high CTR ad with similar total conversions to raise your score.
- In general, the higher the CTR, the higher your quality score.
- You have a strict ROAS target and have to pick an ad above your target.
Let’s look at a full chart of data and then examine how we’d pick the winners (click the chart to see a larger version).
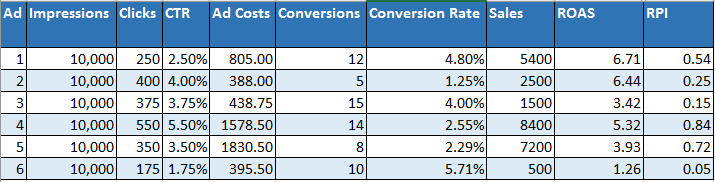
If we want the most conversions possible, then ad 3 is our clear winner. It receives 15 conversions for every 10,000 impressions. However, it has a lower ROAS and RPI than other ads.
If our goal is ROAS, then ad 1 is our winner. It’s also our highest-converting ad. However, it has a low CTR, which means a poorer quality score. It also has a lower RPI and makes less money than some other ads. This is why ROAS is a good metric for bid management, but rarely for ad testing.
If we want the most revenue possible, then ad 4 is our clear winner. It has the highest revenue and RPI (because the impressions are for all ads).
Since RPI doesn’t take ROAS into account, ROAS is often used as a filter. For instance, you might have a goal of 500% ROAS. Therefore, any ads beneath that target can’t be winners, and you remove them.
From the remaining ads, the highest RPI would be your winner. If your goal was a 600% ROAS, then you’d eliminate ad 4 and pick ad 1 as the winner. It has the highest RPI among ads with at least a 600% ROAS.
Using our data to plan our next ad tests
Don’t throw away data from the losing ads. You can always review it to find other ideas to test. For instance, our highest converting ads are 6 and 1. Even ad 3 does better than the highest RPI ad. Therefore, we’d want to take a look at those ads to see what they have that’s bringing in better qualified clicks.
Why does ad 5 have the highest average order value? For instance, does it have different cross sale or upsell items on the landing page?
Ad 2 is a clear conversion rate loser. Does it have ad lines or ideas that we should avoid in the future?
Once we’ve reviewed the data, we can pause all the losers and create a new ad to test against the winning ad.
When not to use RPI
The main time to avoid RPI is when average order value isn’t a consideration. In those cases, you can rely on CPI as your main test metric.
Wrap-up
Revenue or profit per impression is one of the best ad test metrics available. It’s a simple number that shows which ad will lead to the most revenue possible.
If you have strict ROAS targets, use ROAS as a filter and choose the highest RPI ad from the remaining options.
RPI also relies on consistent data. If your orders are highly inconsistent or you have outliers, then CPI may be a better test metric for you.
Choosing a test metric that fits your goals
There isn’t a ‘best’ test metric for everyone. The right metric depends on what you’re trying to achieve.
We’ve put together a quick reference chart:
| What do you want to do? | The metric you should use |
| Increase conversions | Conversions per impression (CPI) |
| Increase visitors | Click-through rate (CTR) |
| Increase engaged visitors | Conversions per impression (CPI) |
| Get the most revenue possible | Revenue per impression (RPI) |
| Improve quality scores | Click-through rate (CTR) |
There are two noticeable metrics missing from this list: ROAS and CPA.
These metrics work best as filters rather than winning metrics.
For instance, if your target CPA is $35, first remove any ads above that threshold. From the remaining ads, choose the one with the highest CPI.
This is when to use filters:
| What do you want to do? | Filtering metric | Winning metric |
| Highest revenue above a specific ROAS | ROAS | Revenue per impression (RPI) |
| Most conversions under a target CPA | CPA | Conversions per impression (CPI) |
Statistical significance: How confident should you be in your test results?
In layman’s terms, statistical significance is how likely a result is caused by something other than random chance. Essentially, it’s how confident you are that random chance didn’t cause winners and losers. Minimum data also plays a role, which we’ll come to later.
For instance, if you flip a coin 4 times, there is a 1/16 chance that heads will show up all 4 times. Yet on the 5th throw, there is still only a 50% chance that you’ll receive another heads. That’s because each time you flip a coin, there’s a 50/50 chance that you will see heads or tails.
However, a short streak doesn’t tell you much. On consecutive throws, you need to take in the variables of the previous throws to work out the chance of seeing heads. That’s why we need a minimum amount of data before we calculate confidence factors.
Eventually, the odds catch up and after 100 flips, you’ll probably have 47-53 heads assuming it’s a regular coin. If after 100 flips, you’ve seen heads 90 times, you should either go to Vegas or your coin isn’t properly weighted.
If you throw a coin 2,000,000,000,000,000,000,000,000,000 times or 2×10 to the power of 27, odds are that you will have 90 heads in a row at some point, purely due to chance. But looking at the entire sample set rather than any one streak of numbers, you’ll see that heads and tails have each come up 50% of the time.
How to pick your confidence factors
When you pick your confidence factors for an ad test result, you’re really saying, “how confident am I that this result is meaningful and not due to chance?”
Your ads are the only part of your account that searchers see, so you want to be confident that you’re choosing winners because of real performance differences and not random chance.
Here’s a reference chart showing confidence factors by keyword types:
| Term type | Minimum confidence |
| Long-tail keywords | 90% |
| Mid-data terms | 90% – 95% |
| Third-party brands you sell | 90% (small brands) to 95% (large brands) |
| Top keywords (the ones you watch daily) | 95% – 99% |
| Your brand terms | 95% (unknown brand) – 99% (well-known brand) |
The overall rule is simple. The more important a keyword is to your account, the higher you want the confidence factors to be before you take action.
Most statisticians consider 90% confidence to be the minimum threshold before making decisions.
Odds are, you’ve segmented your account into various campaigns — brand campaigns, long-tail, information terms, hero terms, competitors, and so forth. Therefore, it’s useful to make a note of your minimum confidence level by campaign type.
There are a few rules to keep in mind when discussing confidence factors:
- Statistical significance is how likely an event is caused by something other than chance (e.g. different ads).
- If your sample size is too small, any result can be due to chance.
- In a large data set, there will be anomalies (like throwing heads 90 times in a row), but the overall data shows you the true results.
- Never go below 90% confidence factors.
Statistical significance and minimum data go hand in hand. Next, let’s look at how much data you need before deciding whether a test result is meaningful.
Working with minimum data
Minimum data is the smallest data set needed to know if a result is statistically significant.
If your ad tests don’t have enough data, then you shouldn’t pause ads or make other changes. Any differences you see could be due to chance and not actual patterns within the data.
For instance, this is a test result after 97 impressions:
|
Ad |
Impressions |
Clicks |
CTR |
Confidence |
|
Control |
40 |
1 |
2.5% |
— |
|
Ad 2 |
33 |
5 |
15.15% |
97.03% |
|
Ad 3 |
24 |
0 |
0% |
15.57% |
In purely math terms, we do have a 97% confidence that ad 2 will be a winner. If this was a static, predictable data environment, we might take action. However, search is a dynamic environment and 97 impressions isn’t enough (even if an online calculator tells you it is).
Here’s the same test after 3163 impressions:
|
Ad |
Impressions |
Clicks |
CTR |
Confidence |
|
Control |
1023 |
23 |
2.25 |
— |
|
Ad 2 |
993 |
29 |
2.92% |
82.9% |
|
Ad 3 |
1147 |
56 |
4.88% |
99.96% |
All ads have around 1000 impressions, and we’re 99.96% confident in our winner. It’s also a different winner than at 97 impressions. We can now make changes based on the CTR testing.
At low data levels, you want to avoid one or two searchers skewing your data. For instance, if you have 100 impressions and 1 click, then you have a 1% CTR. If the next 2 people click your ad, your CTR increases to 2.91% CTR, which is a huge change. It completely changes which winning ad you would have chosen.
When your data starts to grow, ensure you have a large enough sample size so this can’t happen. The more impressions an ad test generates within a given time frame, the larger sample size you want.
The impact of time
It’s also worth considering the impact of time. For instance, imagine these three scenarios:
- You just got to work on a Monday morning and start to search for work related items
- It’s lunchtime on the last Monday of the month and your rent is due soon and you want to figure out finances
- You’re relaxing after dinner on a Monday and you remember something about your day and you want to search more about that item
Your Monday morning conversion could have been a white paper download or phone call. Your Monday evening search probably happened on a mobile phone and your conversion is sending yourself a reminder for Tuesday.
Now, that’s just Monday. If you were looking for vacation cruises, your Monday search was thinking about how much you want to escape the office. That same search on a Saturday afternoon might be planning with your spouse which cruise to book.
As time frames change, so does search behavior. That’s why we need to take into account not just the data, but the time frame, too.
You should always use at least a week of data. However, one month to three months of data is also good.
When determining minimum data, there are two considerations:
- Your test metric
- How much data you generate each month
Your test metric
Your test metrics tell you which data points to define.
As an example, if you’re testing by CTR, your conversions don’t matter. CTR doesn’t use conversion data in its calculation.
Most metrics have both a required data point (as that’s the opportunity) and a secondary data point (action).
For instance, CTR is the ratio of impressions to clicks. You must have an impression to get a click — impressions are mandatory but clicks are optional.
In some cases, you might not want to define the optional metric. Let’s say we’re running two ad tests with this data set:
- Ad 1: Impressions 1000, clicks 100
- Ad 2: Impressions 1000, clicks 10
In this test, we’re confident that ad 1 is the better ad, with a 90% confidence level. However, if we defined a minimum of 25 clicks, we’d still be waiting for results since ad 2 hasn’t hit that number yet. Optional data points mean you might wait longer to achieve results if one of your tests is significantly below average (in this case a 10% vs 1% CTR).
Every ad in the test should hit the minimum data before you look at the information, not the test combined. There are two ad rotation options, which we will cover later, and it’s common that not all ads within a test have the same opportunity. That means each ad should meet the threshold before you check your confidence levels.
Here’s the minimum data that you should define by test metric:
| Metric |
Impressions |
Clicks |
Conversions |
Time frame |
|
CTR |
Yes |
Optional |
— |
Yes |
|
CPA |
— |
— |
Yes |
Yes |
|
Conversion rate |
— |
Optional |
Yes |
Yes |
|
CPI |
Yes |
— |
Optional |
Yes |
|
ROAS |
— |
— |
Yes |
Yes |
|
RPI |
— |
— |
Yes |
Yes |
How much data do you generate each month?
We’re often asked to suggest minimum data amounts. That’s difficult, because not everyone should be using the same numbers.
If you have a brand term with 1 million searches per week, your test should collect at least a million impressions. Many brands don’t have 1 million searches in a year, and could work with 10,000–100,000 impressions.
These are minimums. It’s OK to use higher numbers than these.
Minimum data recommendations for most companies:
|
Impressions |
Clicks |
Conversions |
|
|
Low traffic |
350 |
300 |
7 |
|
Mid traffic |
750 |
500 |
13 |
|
High traffic |
1000 |
1000 |
20 |
|
Well-known brand terms |
100,000 |
10,000 |
100 – 1000 |
As your campaigns are often segmented by brand, product terms, long tail, etc, each campaign’s ads can generally use the same minimums. You’ll often need different metrics, minimums, and statistical significance factors for different parts of your account.
Defining maximum data
There are times when you’ll run an ad test, but the test is too similar or users don’t react much differently to your test variations. You’ll never reach statistical significance.
If you only define minimum data and confidence factors, your tests can run for years and you’ll miss an opportunity to boost your conversions.
That’s why you should define a maximum data threshold as well.
If your ads hit your maximum threshold without achieving your minimum confidence levels, then you need to end the ad test and move on.
There are usually two ways to define maximum data:
- 10x your minimum data
- A 3-month time frame (assuming your tests are above minimum data)
Defining both minimums and maximums for your ad test ensures that you’re focusing on actionable information. Even if that action is to just end the test and start from a different hypothesis.
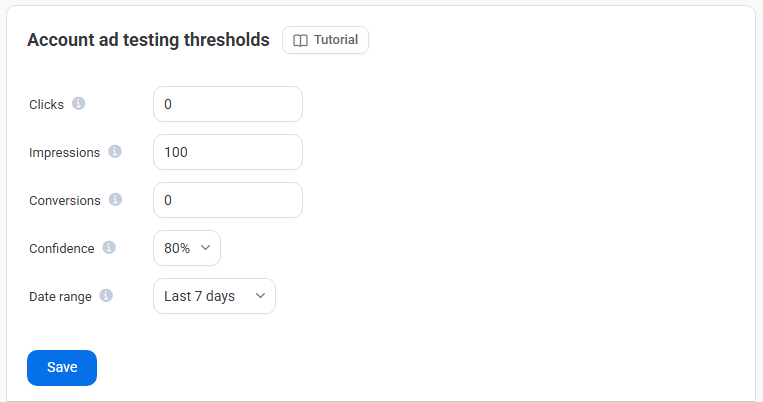
For Adalysis users, we automatically alert you to test results:
- Above the minimum thresholds
- Running for at least 3 months
- Haven’t achieved your minimum confidence levels
If you’re testing within Excel or another system, make sure you have a similar safeguard in place.
Adalysis monitors your ad tests against your minimum data, maximum data, and confidence thresholds. You’ll know when there’s enough evidence to choose a winner and when a test has run long enough without producing a meaningful result.
Ad rotation settings
If you have multiple ads in an ad group, your ad rotation settings determine how often each ad shows. Your setting will affect how likely you are to get statistically significant data, so we recommend basing your choice on your metrics.
There are currently only two ad rotation settings you can choose for your Google Ads campaigns:
- Optimize: Prefer best performing ads
- Do not optimize: Rotate ads indefinitely
Ad served percentage
The ad served percentage shows you how often each ad showed across your account, campaign, or ad group.
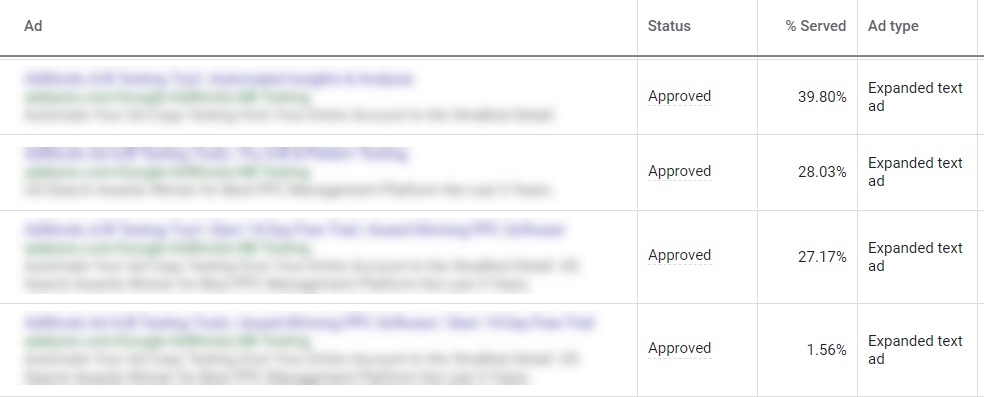
Keep in mind the time frame you’re reviewing. If you paused or deleted ads that were active during that time frame, then your ad served percentages may not add up to 100%.
It’s useful to only review data when all the ads ran at the same time. Let’s say you’re looking at the last three months of data, but you created an ad one month ago. It’ll look like the newer ad has a low ad served percentage, because it wasn’t active for the other two months.
How ad rotation affects minimum data
All ad tests should have a minimum amount of data, such as time, clicks, impressions, and conversions. These may vary depending on metrics you’re using and the type of keywords you are testing (such as brand vs. product).
When your ad served percentages are skewed towards a single ad, the other ads receive fewer impressions. As a result, the other ads also receive fewer clicks and conversions. It also takes longer for those ads to build up enough data to make statistically significant decisions. You can collect the data faster with the right ad rotation setting.
Which setting to choose?
Optimize: Prefer best performing ads
This is the only option if you use Google automated bidding. Even if you haven’t explicitly chosen it in the settings, Google uses Optimize to serve your ads.
As ads are served unevenly, your ad test generally takes longer to reach statistical significance. This setting sometimes displays the incorrect ad the most, which can lower your clicks and conversions. Make sure you’re testing ads, choosing winners, and pausing losers to avoid this scenario.
This example shows how the ad with the best data in every metric was served 55,656 times. The ad that lost every metric was served almost 6 times as often at 299,221 impressions.
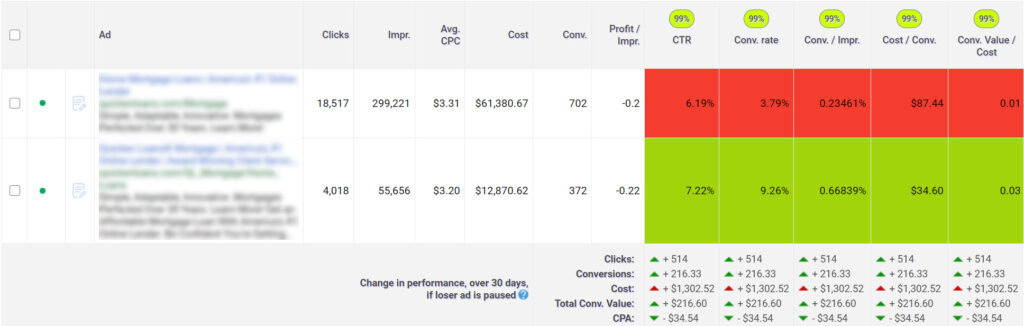
If this advertiser pauses the losing ad, their clicks and conversions would immediately increase. This is why you need to watch your ad tests when using Optimize. Once Google’s machine learning decides which ad to show the most, it rarely corrects itself later.
Do not optimize: Rotate ads indefinitely
If you’re setting manual bids, using a script or a third-party bid manager, then you should use Do not optimize.
It’s the best ad rotation setting, as all ads have a higher chance of getting an equal impression share.
Here’s another example. In this ad test, one ad wins on CTR and another wins in every other metric. True optimization would mean the ad with the highest conversions per impression shows most often.
In this case, the ad with the highest CTR shows three times as often as the ad with the highest conversion rate and CPI. Google often defaults to CTR over other metrics.
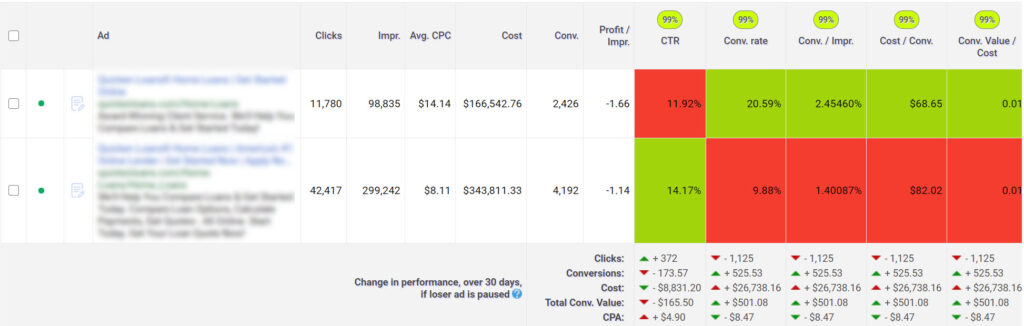
In this scenario, Do not optimize would mean your ads get roughly similar exposure. This change would help you to quickly find out which ad generates more conversions.
If you have five or more ads in an ad group, Google’s ad serving can become very confused. Ads may seem to get served randomly, rather than showing the best ad the most.
For instance, in this ad test, the ads with the lowest impressions win based on CTR and other metrics. (We’ve sorted the chart by impressions.) Yet the overall worst ad is being served more often.
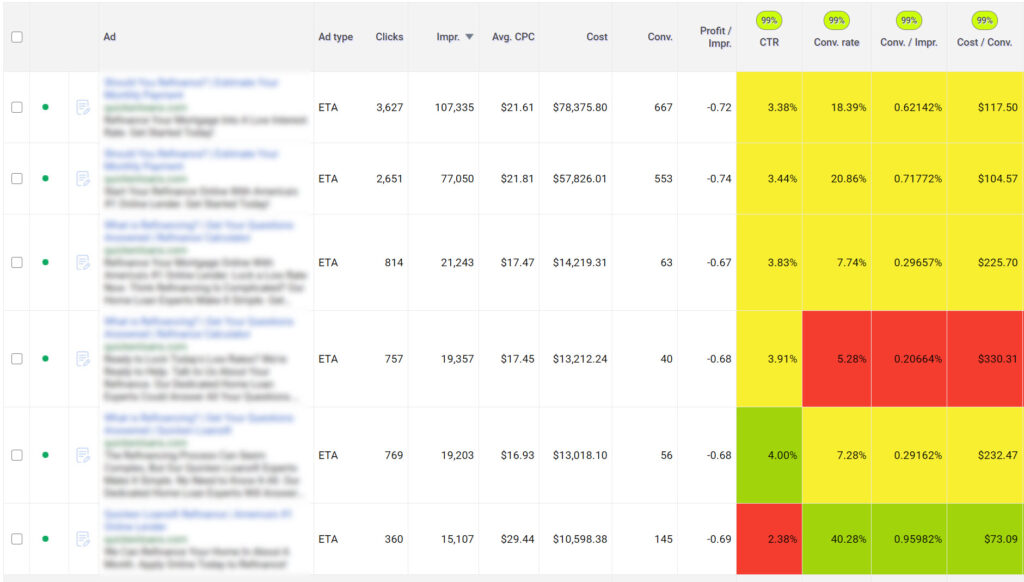
This also happens often when you introduce new ads. With Optimize ad serving, new ads may not get enough impressions to show what they can achieve.
For manual bidding campaigns, use Do not optimize. You’ll get faster test results and more even ad serving. It also makes multi-ad group testing very accurate.
However, if you can’t regularly check your ad tests or add new ads, then ‘Optimize’ is fine. Google’s decision-making is still better than doing nothing.
Ending your ad tests
Ask yourself:
- Has your test met your minimum data threshold?
- Has it reached your minimum confidence level?
- Has it reached your maximum data threshold?
If yes, it’s time to act. Otherwise, you’ll need to wait for more data.
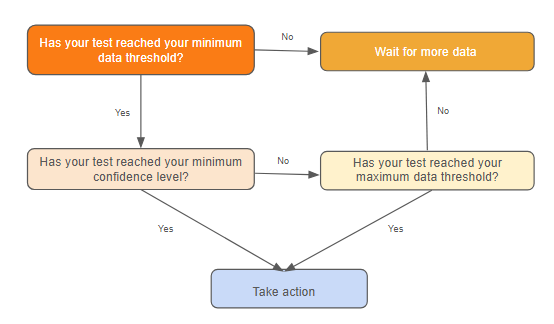
Actions could include:
- Pausing the losing ads
- Creating new ads to replace the losers
- Reviewing the ads for further insight
Further insights might sound vague, so here are some examples:
- You hypothesized that your CPI would increase if you added a credibility factor to the ad. The hypothesis was correct, and now you want to test that message on your website.
- You tested several calls to action and found one that worked great. You’re now going to use it in your emails.
- You tested description line 1s to increase CTRs for the organic search team. You found a winner, and now you’re going to test it within your title tags to see if it’ll increase your SERP CTR.
It’s more common to gain insights from multi-ad group tests than single ad group tests. This is because multi-ad group tests include a lot more keywords and ad groups.
The actions themselves aren’t difficult. The trick is to first determine your criteria for winning and losing ads so that you know when to take an action.
Wrap-up
The overall steps to ad testing are:
- Determine your hypothesis
- Decide the test’s scale & type
- If you want to know the best ad for a specific target, use single ad group testing.
- If you want to know the best idea across ad groups, use multi-ad group testing.
- Choose how you will pick winners
- Set up your tests
- Wait for data
- Take action
Ad tests give you an amazing amount of insight about how users interact with your ads. These insights are useful for improving your PPC performance and other marketing channels.
Make ad testing easier to manage at scale. Use Adalysis to run single and multi-ad group tests, monitor results, and apply winning ads in bulk.


Get a free copy of our Ad Testing Guide
Share around the web



Scale your PPC performance,
not your workload.