Categories
Responsive search ads (RSAs) give you a lot of control over how your ads appear. You can let Google choose which headlines to show or pin assets to specific positions.
In 2022, our RSA studies found that pinned ads had higher conversion rates than unpinned ads.
Google has improved how RSAs are served since then, so we wanted to see how pinning affects performance today.
We get these questions most often:
- Should I pin my ads?
- How many lines do most advertisers pin?
- Will pinning decrease my CTR?
- Will pinning increase my conversion rates?
Here’s what our latest study found. Jump to the end for notes about the 5900 accounts included in the data.
How Google serves unpinned RSAs
You can pin one or more assets to one or more headlines.
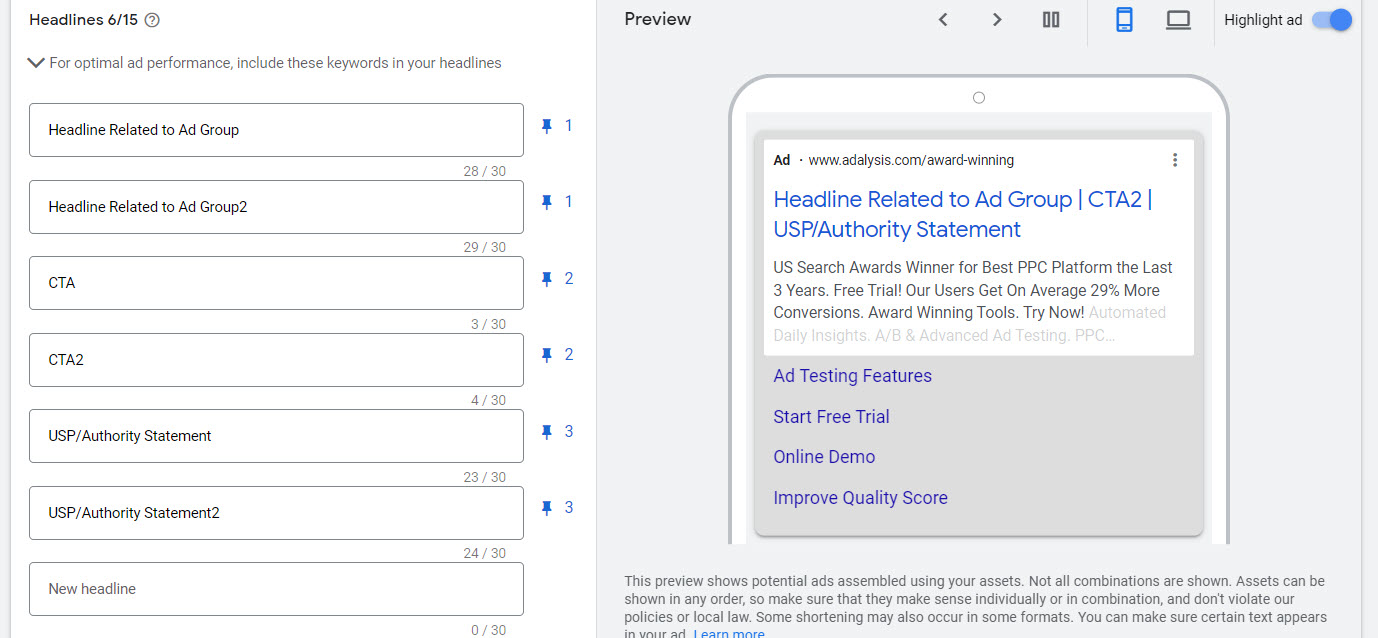
For RSAs that don’t use pinning, Google usually ends up showing ads in this formula:
- Headline 1: Related to the keywords in the ad group; often contains the keyword
- Headline 2: A CTA, benefit, or feature of the product or service
- Headline 3: Rarely shows, but when displayed, it’s often a headline that talks about the business, such as ratings, service, or delivery info
This is the same formula companies followed for creating successful ETAs years ago. Pinning ensures Google learns how to serve your assets within that framework.
Why pinning increases data density
Advertisers also pin assets because Google needs a tremendous amount of data to test RSA combinations.
With 15 headlines and 4 descriptions, your RSA can produce 50,235 combinations. Pinning reduces that number, giving Google better data density to understand and serve your ads.
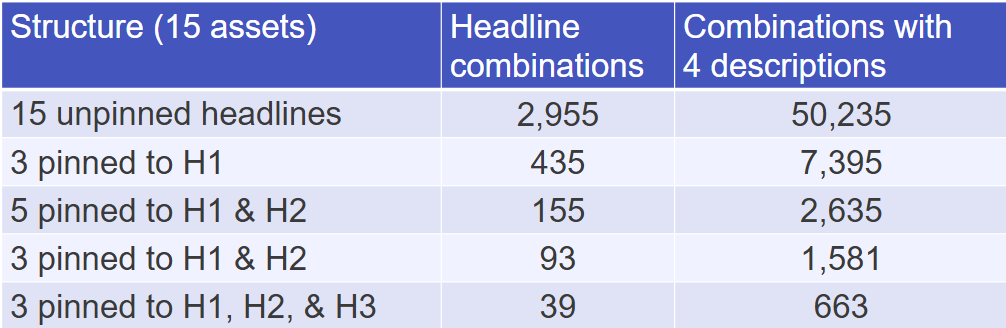
It can be hard to visualize how long Google needs to learn how to serve more than 50,000 combinations.
Let’s say you have an ad group that gets 10,000 impressions every month. And you want each combination to receive at least 100 impressions. To understand how a combination would perform, this is how long you’d have to wait:
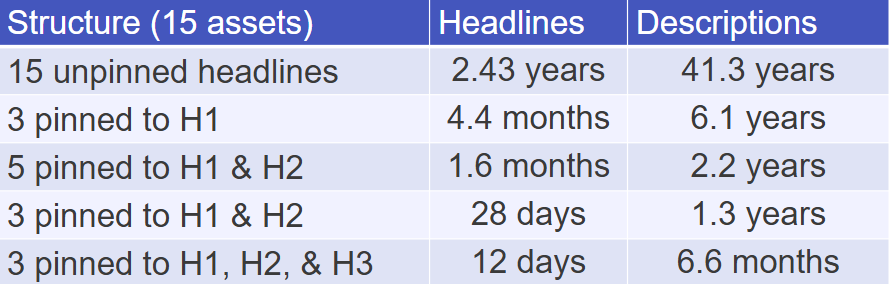
Obviously, we can’t wait years for a test. Google also doesn’t test every combination one by one. It uses AI to predict which ones will perform well. Therefore, our goal is to compare Google’s choices with advertiser-controlled pinning.
How many lines do advertisers pin?
We split the ads into four categories:
- Pin 0: No assets pinned
- Pin 1: At least one asset pinned to a single headline
- Pin 2: At least one asset pinned to two different headlines
- Pin 3: At least one asset pinned to three different headlines
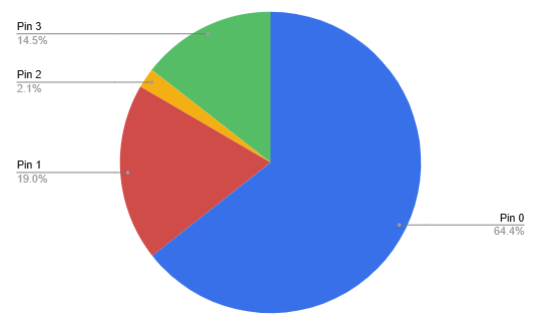
The vast majority of ads don’t have any pinning. This isn’t surprising since that’s what Google recommends.
What is interesting is how few companies pin two lines. Because this category has few ads, we expect to see some odd data. However, the study includes enough ads to make all the results statistically significant.
Next, we looked at which headlines advertisers pin and how often they pin one asset versus two or more.
Pin 0: No assets pinned
Unpinned ads have an average of 13.53 headlines. 69% of all ads use 15 headlines.
Pin 1: At least one asset pinned to a single headline
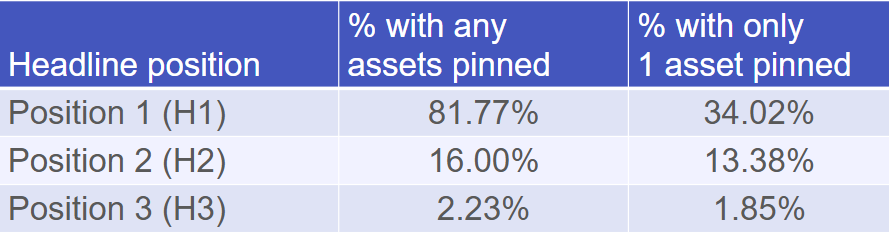
Position 1 is the clear favorite for single-headline pinning. 34% of advertisers using this spot choose only a single asset. When advertisers pin several assets to headline 1, the average is 4.2.
Pin 2: At least one asset pinned to two different headlines
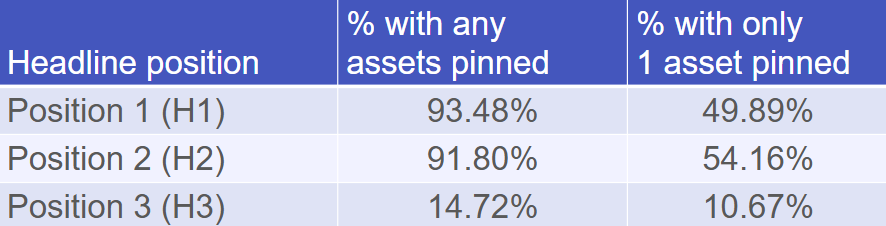
For ads that pin two headlines, positions 1 and 2 are by far the most common combination. Roughly half of advertisers pin one asset to each position. When several assets are pinned, the average is a little over 3.5.
Pin 3: At least one asset pinned to three different headlines
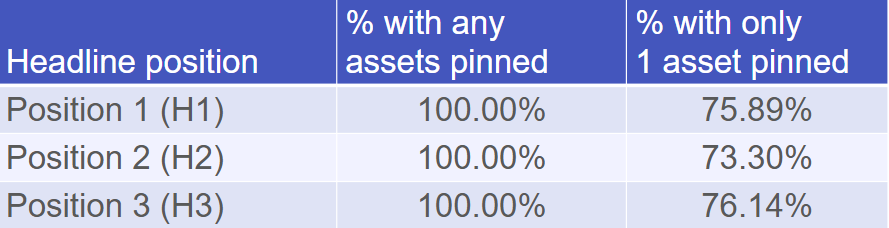
Advertisers who pin all three headlines usually pin one asset to each. Around 75% of these RSAs follow this pattern.
When they pin headlines, the averages are higher than for other combinations: more than five assets in position 1 and almost six in position 2.
It’s worth noting that advertisers who pin all three headlines are also the most active ad testers. They’re more likely to act on statistically significant results, pause losing ads, and create new challengers.
While pinning clearly improves the results, it also restricts Google’s AI from learning how to serve your ads. If you plan to analyze and act on your ad test data, then pinning all three headlines is a good idea. However, if you’re not going to actively manage your tests, then you should rely more on Google’s AI to determine your ads. Only pin one or two headlines in that case.
Weighted results: More pinned headlines, higher conversion rates
All ads in this study have at least 250 impressions, but some have millions. We split the results into two sections.
In this section, ads with more impressions carry more weight. We added up the impressions, clicks, and conversions for ads in each category. Then, we calculated the CTR, conversion rate, and conversions per 1000 impressions (CPI).
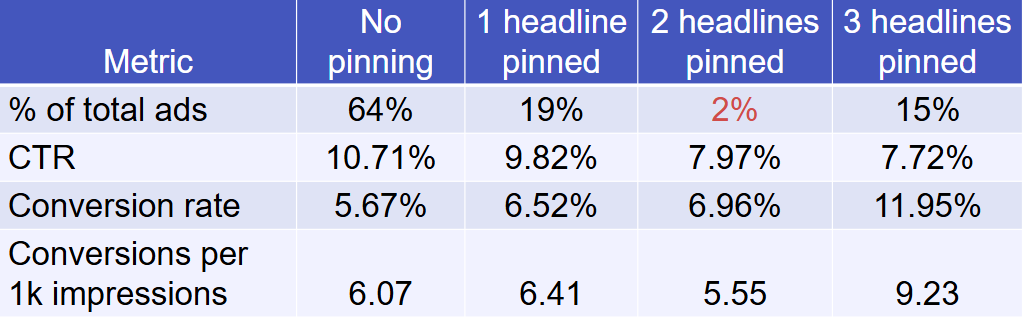
The data shows that as you pin more, your CTR drops. This is expected, since advertisers who pin are often trying to bring in a specific visitor type. They don’t want as many clicks as possible, just the correct ones.
Google also often falls back on CTR for ad serving, preferring to serve the highest CTR ads since that makes them more revenue.
As advertisers pin more, the conversion rates also increase. The difference between 0 pins and 2 pins is less than 2%. However, advertisers who pin all three lines have a vastly superior conversion rate.
As noted earlier, this isn’t just due to pinning. These advertisers account for 15% of the total ads, but they’re the most active ad testers. We would expect their conversion rates to be higher than any other group.
Looking at conversions per impression, which combines CTR and conversion rate, advertisers who pin two lines have the lowest CPI of any group. Since this category is only 2% of the ads studied, it could be a data anomaly.
The overall trend is clear: for the weighted data, more pinning means better metrics.
Unweighted results: CTR stays flat, conversion rates still rise
The first analysis favors larger accounts because ads with more impressions carry more weight. With unweighted data, every ad counts the same, no matter how many impressions it has.
Each ad in this study has at least one conversion, confirming that conversion tracking is active. This can push conversion rates higher. For example, an ad with 250 impressions could have one click and one conversion, skewing the data.
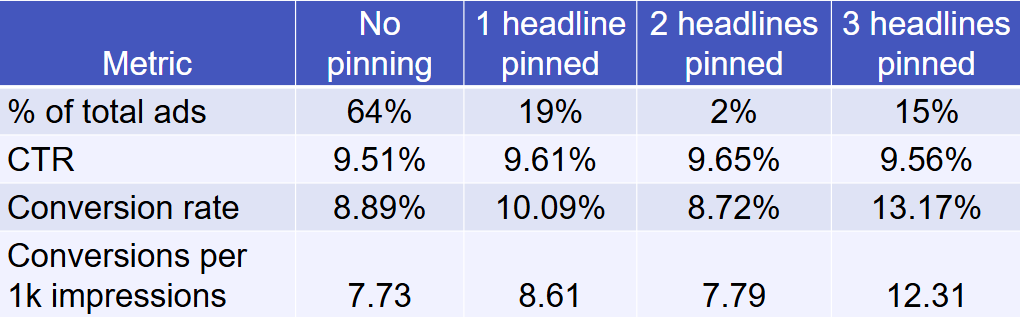
So we ran the unweighted data twice: once for all ads with at least 250 impressions, and again for ads with at least 100 clicks. This second pass reduces the impact of ads with few clicks and one conversion. Here are the results:
Ads with at least 250 impressions
Ads with at least 100 clicks and 250 impressions
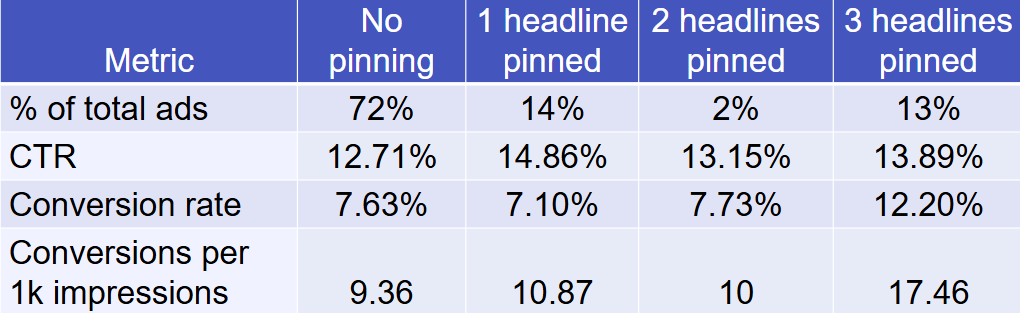
As expected, giving every ad equal weight results in higher overall CTRs and conversion rates.
However, unpinned ads no longer have the highest CTRs. That’s expected too, as most unpinned ads have over 50,000 possible combinations. (Some do use fewer than 15 headlines and 4 descriptions.) It takes Google a while to learn which combinations to serve.
In smaller accounts that skip pinning, we often see the headlines repeating themselves. Google leans on assets related to the search terms rather than ad lines with CTAs and benefits.
For example, this RSA has many assets with CTAs, benefits, and user satisfaction. However, with low data volume, Google hasn’t served most of those assets and prefers just to show assets related to the search terms.
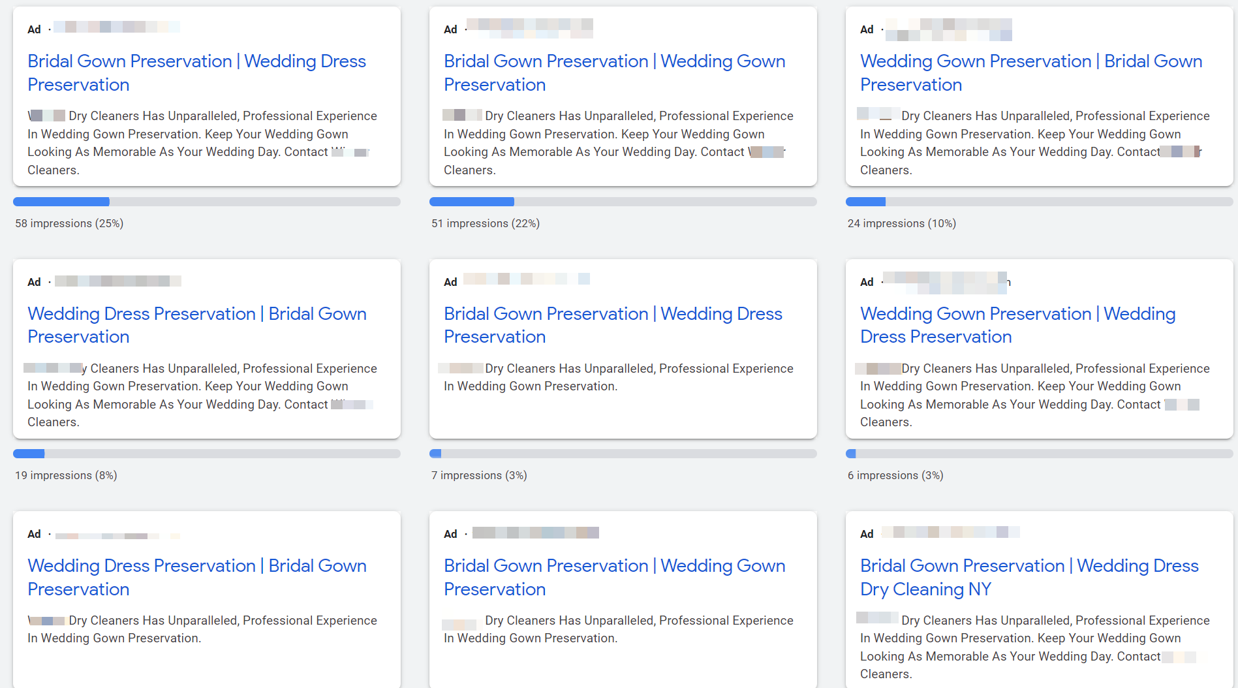
When you pin keyword-related lines to position 1 and benefits or CTAs in headline 2, you’re telling Google how you want the ads to appear. This can bypass the AI’s need to see tens of thousands of impressions before it learns how to serve those ads.
We still see the general trend that as pinning increases, so does the conversion rate.
Arguably the most important metric here is CPI (conversions per 1,000 impressions), since it combines both CTR and conversion rate. This metric steadily increases as you pin more headlines.
Wrap-up
Regardless of how you crunch the data, pinning assets increases your conversion rates. Google’s AI still isn’t very efficient at recognizing that searchers respond best to ads that are both relevant to their query and give them a reason to act (CTAs, benefits, ratings, etc.).
CTRs can vary dramatically based on how you look at the data. Weighted data shows that pinning lowers CTR, while unweighted data shows little difference.
However, the metric most advertisers should care about is conversions per impression. It factors in both CTR and conversion rates to show which ad will drive the most conversions. There’s a clear trend: pinning your ads increases your overall conversions.
Most advertisers should have a pinning strategy. When you pin your ads, you gain control over your ad strategy.
Searchers don’t know your keywords, bids, location targeting, or anything else about your account. The only part of your account a searcher sees is your ads.
Ads are your conversation with a searcher. They persuade a user to do business with your company. If you’re not controlling your ad strategy, you’re letting Google decide the marketing messages potential customers see. Pinning helps you control your message.
Once you’ve chosen an approach, the next challenge is applying it at scale. Updating pins one ad at a time across dozens of ad groups is slow and easy to get wrong. In the Adalysis RSA Manager, you can pin or unpin an asset across all selected ads at once. The Pinned column shows how many ads already pin each asset, so you can spot gaps in your strategy. You can also edit or delete assets across every ad that uses them.
To learn more, explore our ad testing guide and video. They’ll help you test your RSAs and create ads that stand out from the competition. To put your pinning strategy into practice, start a 30-day free trial.
About the data
At Adalysis, we have a tremendous amount of data. We wanted to make sure the ads used in this test represent what most people see in their unbranded ad groups. Over 5900 accounts had ads that matched these criteria:
- Ads must be at least 30 days old
- Ads must have at least 250 impressions
- We use weighted and unweighted metrics to compare different search volumes fairly. High-volume ads can have millions of impressions.
- Ads had at least one conversion
- Many accounts don’t have conversion tracking in place, so this ensures we only use ads from accounts with tracking that works
- No branded ads
- No ads with data anomalies (over 100% conversion rates, CTRs, etc.)
- No campaigns with final URL expansion since that feature can ignore pinning
Share around the web





Scale your PPC performance,
not your workload.


Leave a comment