Google Ads data study: Does a higher ad strength improve your performance?
By Brad | 0 comments October 27, 2026
Categories
In 2022, we carried out a massive data study looking at ad strength. The results pointed in two directions:
- Ads with higher ad strength got more impressions
- Ads with lower ad strength had higher conversion rates
In other words, high ad strength came with more visibility, but that extra visibility didn’t convert as well.
That was four years ago, and a lot has changed since then. We reran the study to find out whether those findings still hold. We also wanted to answer the questions we hear most from advertisers:
- Is it worth aiming for an Excellent rating?
- How does ad strength affect impressions and conversion rates?
- What does it take to reach Excellent?
- How does pinning affect ad strength?
What happens when ads in the same ad group have different ad strengths? Here are our findings and advice on applying the insights to your campaigns. Jump to the end for notes about the over 5,900 accounts included in the data.
What is ad strength?
Ad strength is Google’s measure of your responsive search ad’s relevance, quantity, and content diversity. Ratings range from Excellent to Poor.
As you build an ad, Google shows recommendations for improving its ad strength.
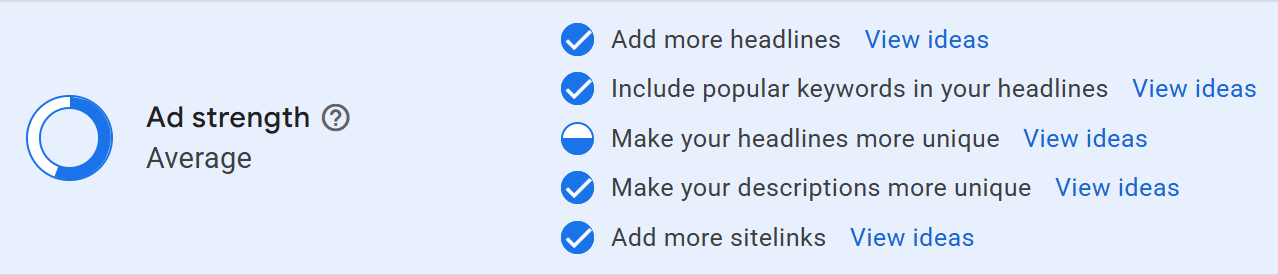
This advice is straightforward, but one recommendation deserves more attention: Make your headlines more unique.
When your ad assets combine benefits, keywords, and calls to action, your ad strength will increase. Often, so will your CTR and conversion rates. We could easily argue this is the most important factor when creating great ads.
If you pin assets, Google counts fewer unique lines, so this ad strength factor decreases.
These terms are also used throughout the study:
| Asset | The content that makes up the headlines and descriptions in your ads. |
| CPI | Conversions per impression, multiplied by 1000 to make it easier to read. Since CPI combines CTR and conversion rate, it’s one of the best metrics for how effective an ad is. |
| Headline or position | This refers to where assets are placed or pinned in an ad. |
| Weighted data | Ads with more impressions carry more weight. Metrics were calculated from the combined impressions, clicks, and conversions in each category. We used this data to calculate CTRs, conversion rates, and conversions per 1000 impressions (CPI). |
| Unweighted data | Every ad counts the same, no matter how many impressions it has. |
The results: How ad strength and pinning affect performance
Many advertisers never pin; others always do. And some want to see all the data before they make up their minds. We’re going to get to the heart of the results and see how pinning and ad strength affect CTR, conversion rates, and CPI (conversions per 1000 impressions).
For unpinned ads, higher ad strength means better results
Getting an unpinned ad to Excellent ad strength takes work. We wanted to know if that effort pays off.
To find out, we looked at ads for non-branded search terms to see if increasing ad strength leads to better results.
The charts below show unweighted data. This ensures ads with millions of impressions don’t skew the results over ads with lower impression counts.
Unweighted data: Ad strength metric comparisons
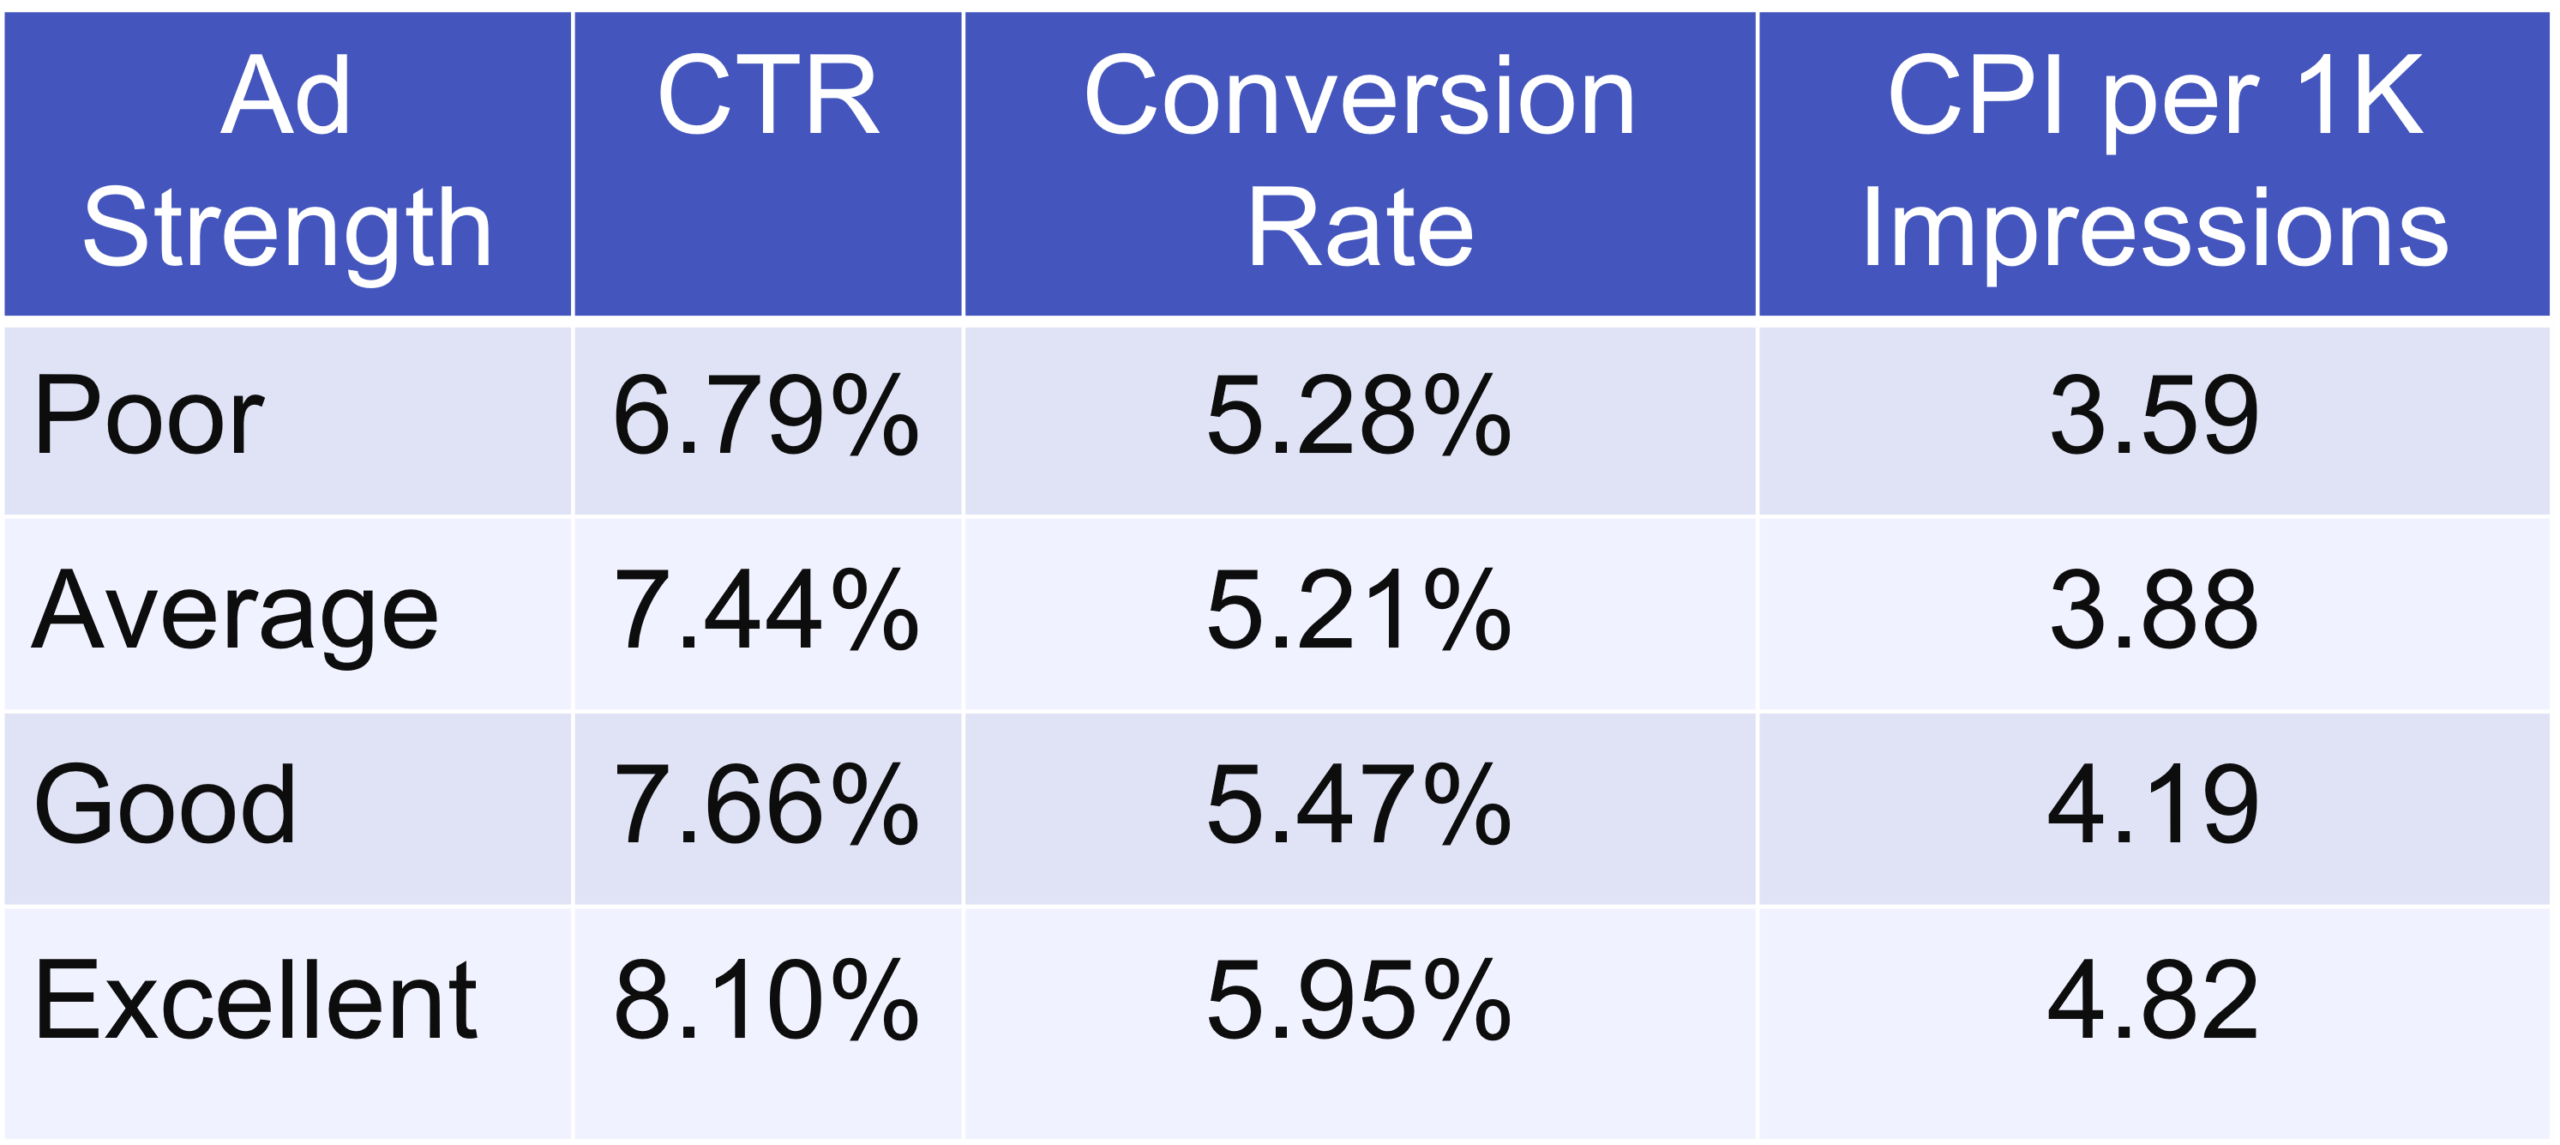
CPI is conversions per impression, multiplied by 1000 to make it easier to read. Since CPI combines CTR and conversion rate, it’s one of the best metrics for how effective an ad is.
CTR increases with every step up in ad strength. Conversion rates also rise slightly, with the small exception of Poor to Average ads. Since CTR improves quite dramatically, CPI also increases at each ad strength level.
We ran the same analysis on weighted and unweighted data, and the results were very similar. CTR and CPI rise with ad strength, and conversion rates generally do too.
This leads us to conclude that if you don’t pin your ads, you should aim for Excellent ad strength.
Pinned ads benefit from higher ad strength too
Pinning usually lowers ad strength, so we wanted to see how pinned ads perform. To have a benchmark, we compared them with unpinned ads rated Excellent, which make up 33% of all unpinned ads.
Unweighted metrics by pinned combination
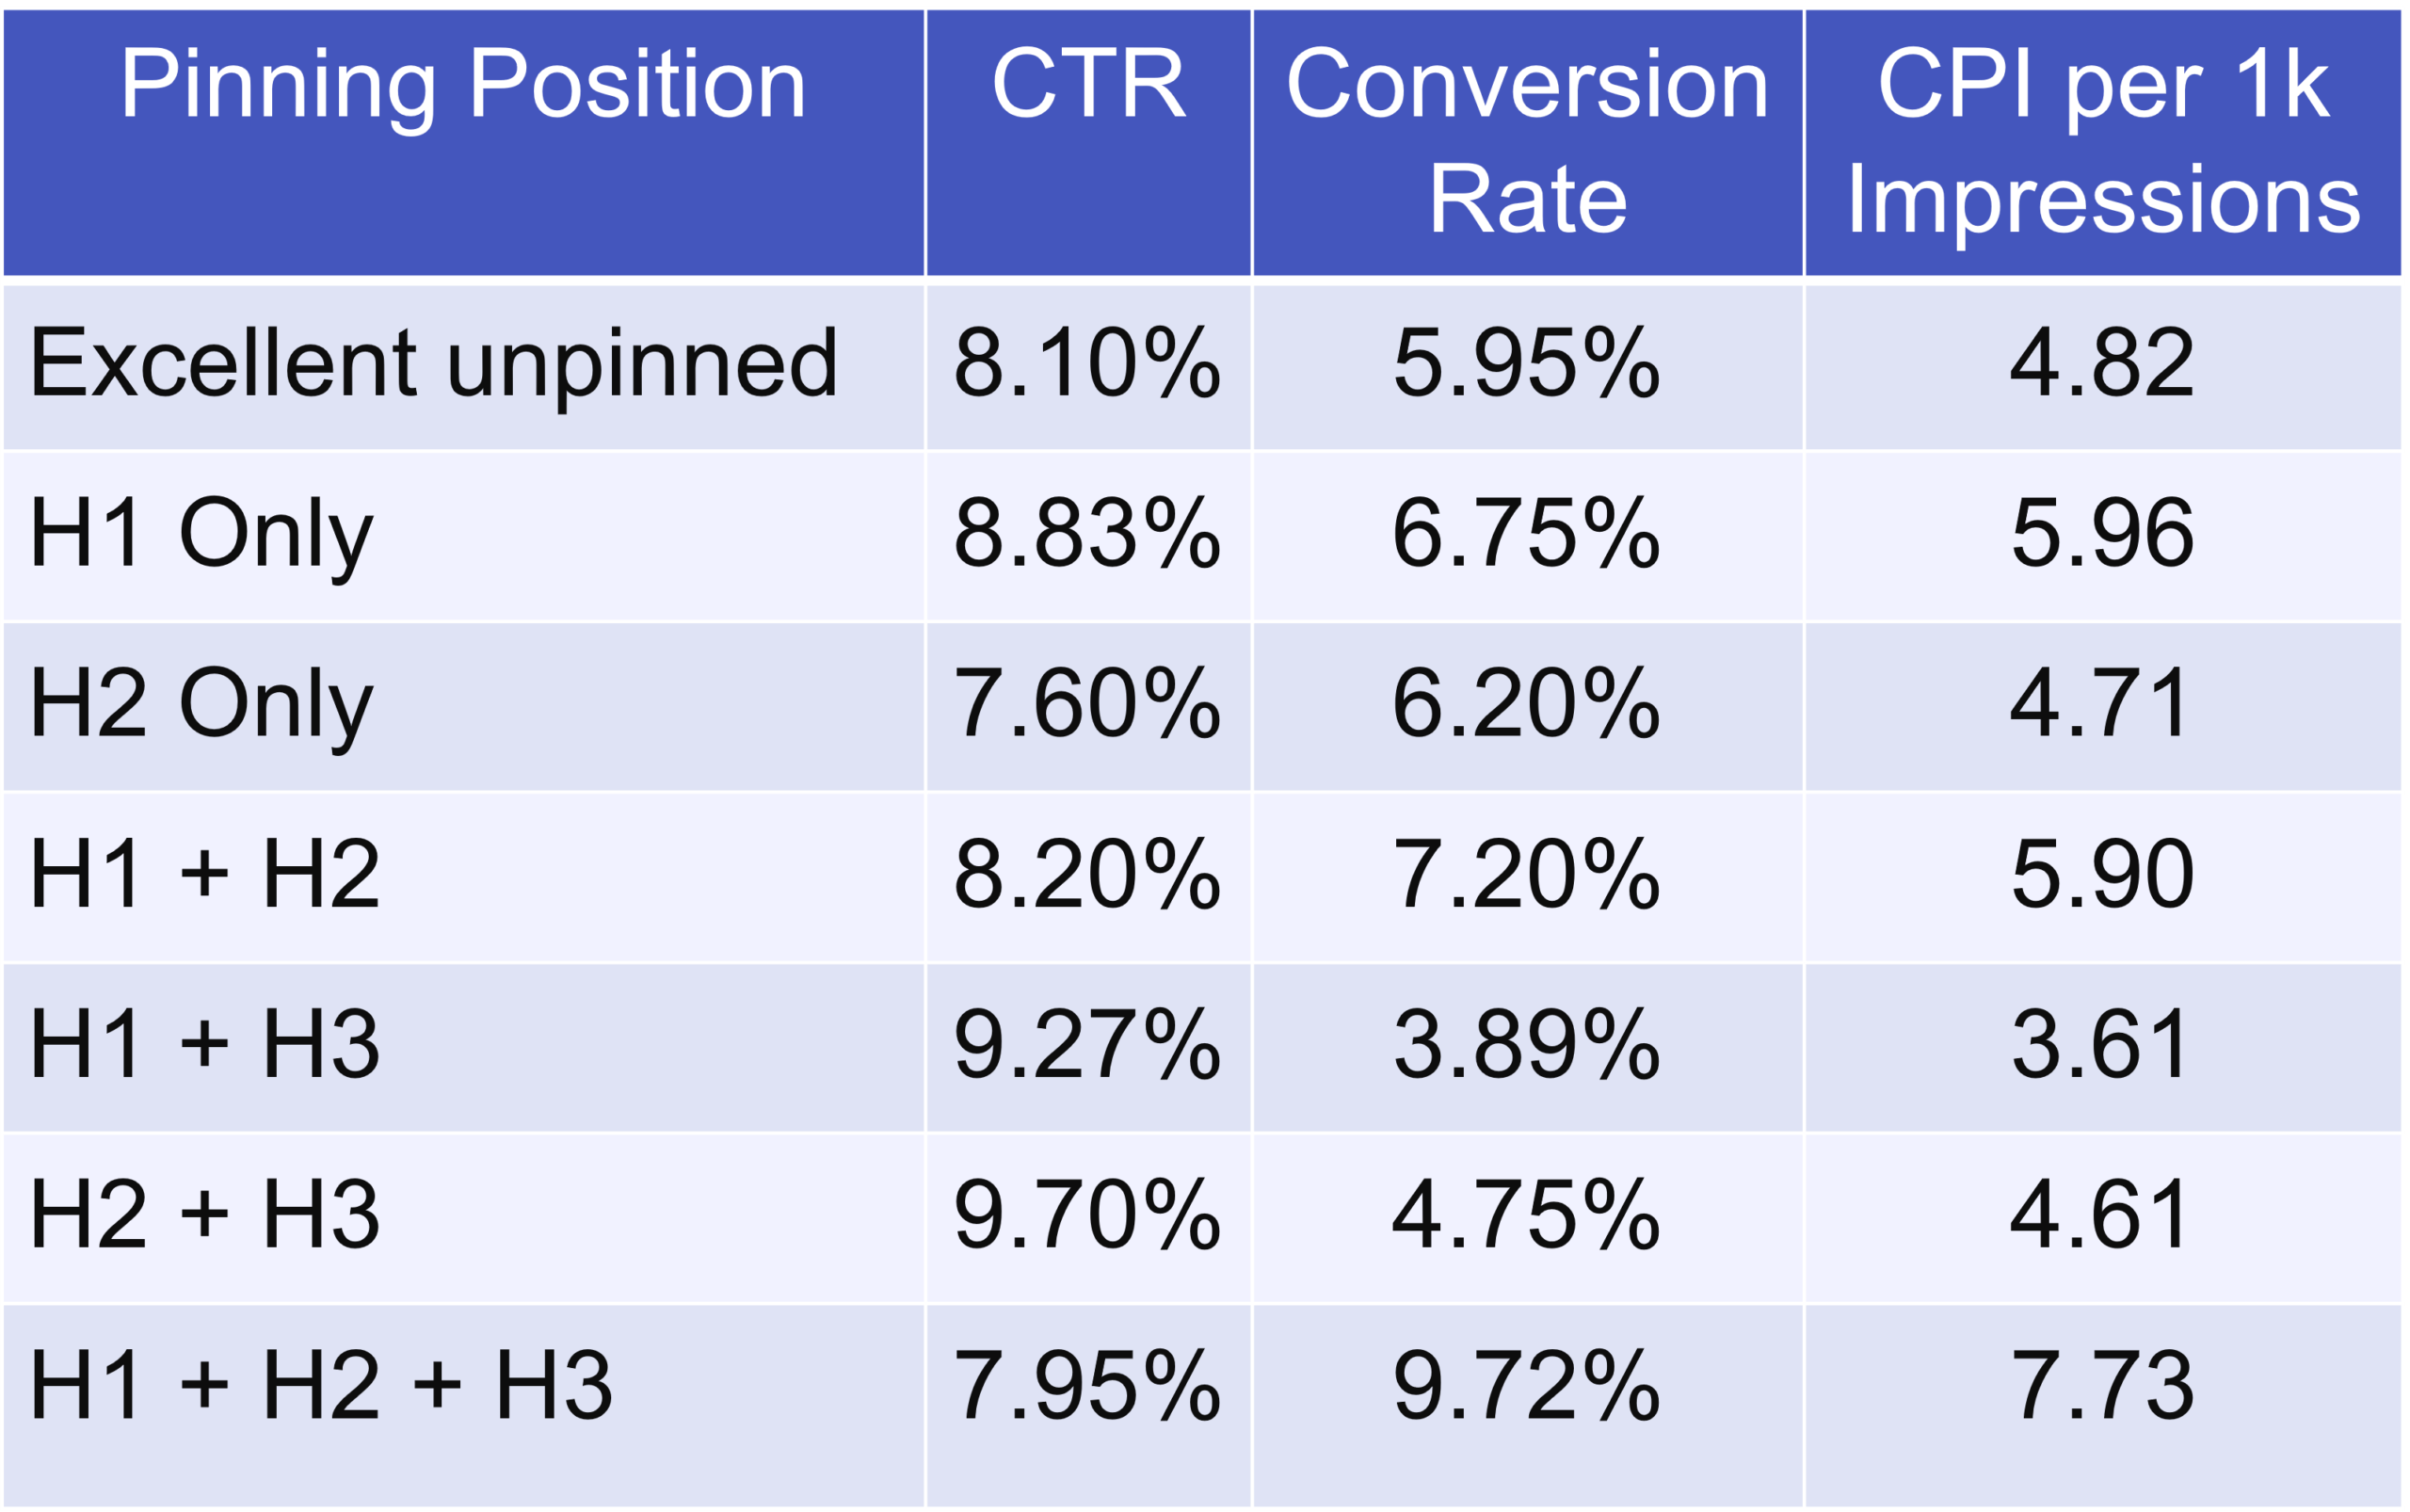
Most assets pinned to headline 2 pre-qualify users, which is common in B2B and industries targeting a very specific audience. It’s no surprise that ads pinning only this position have lower CPIs and conversion rates, when compared to advertisers who only pin headline 1, or headline 1 and 2.
The results for ads that pin headline 3 alongside headline 1 or 2 are harder to explain. These ads have the highest CTRs but the lowest conversion rates, even though headline 3 doesn’t show that often.
The stats above include pinned ads at every ad strength rating. We wanted to see whether higher ad strength makes a difference. That’s why we ran the same analysis on pinned ads rated Good and compared them with unpinned ads rated Excellent.
Pinned performance — Good ad strength
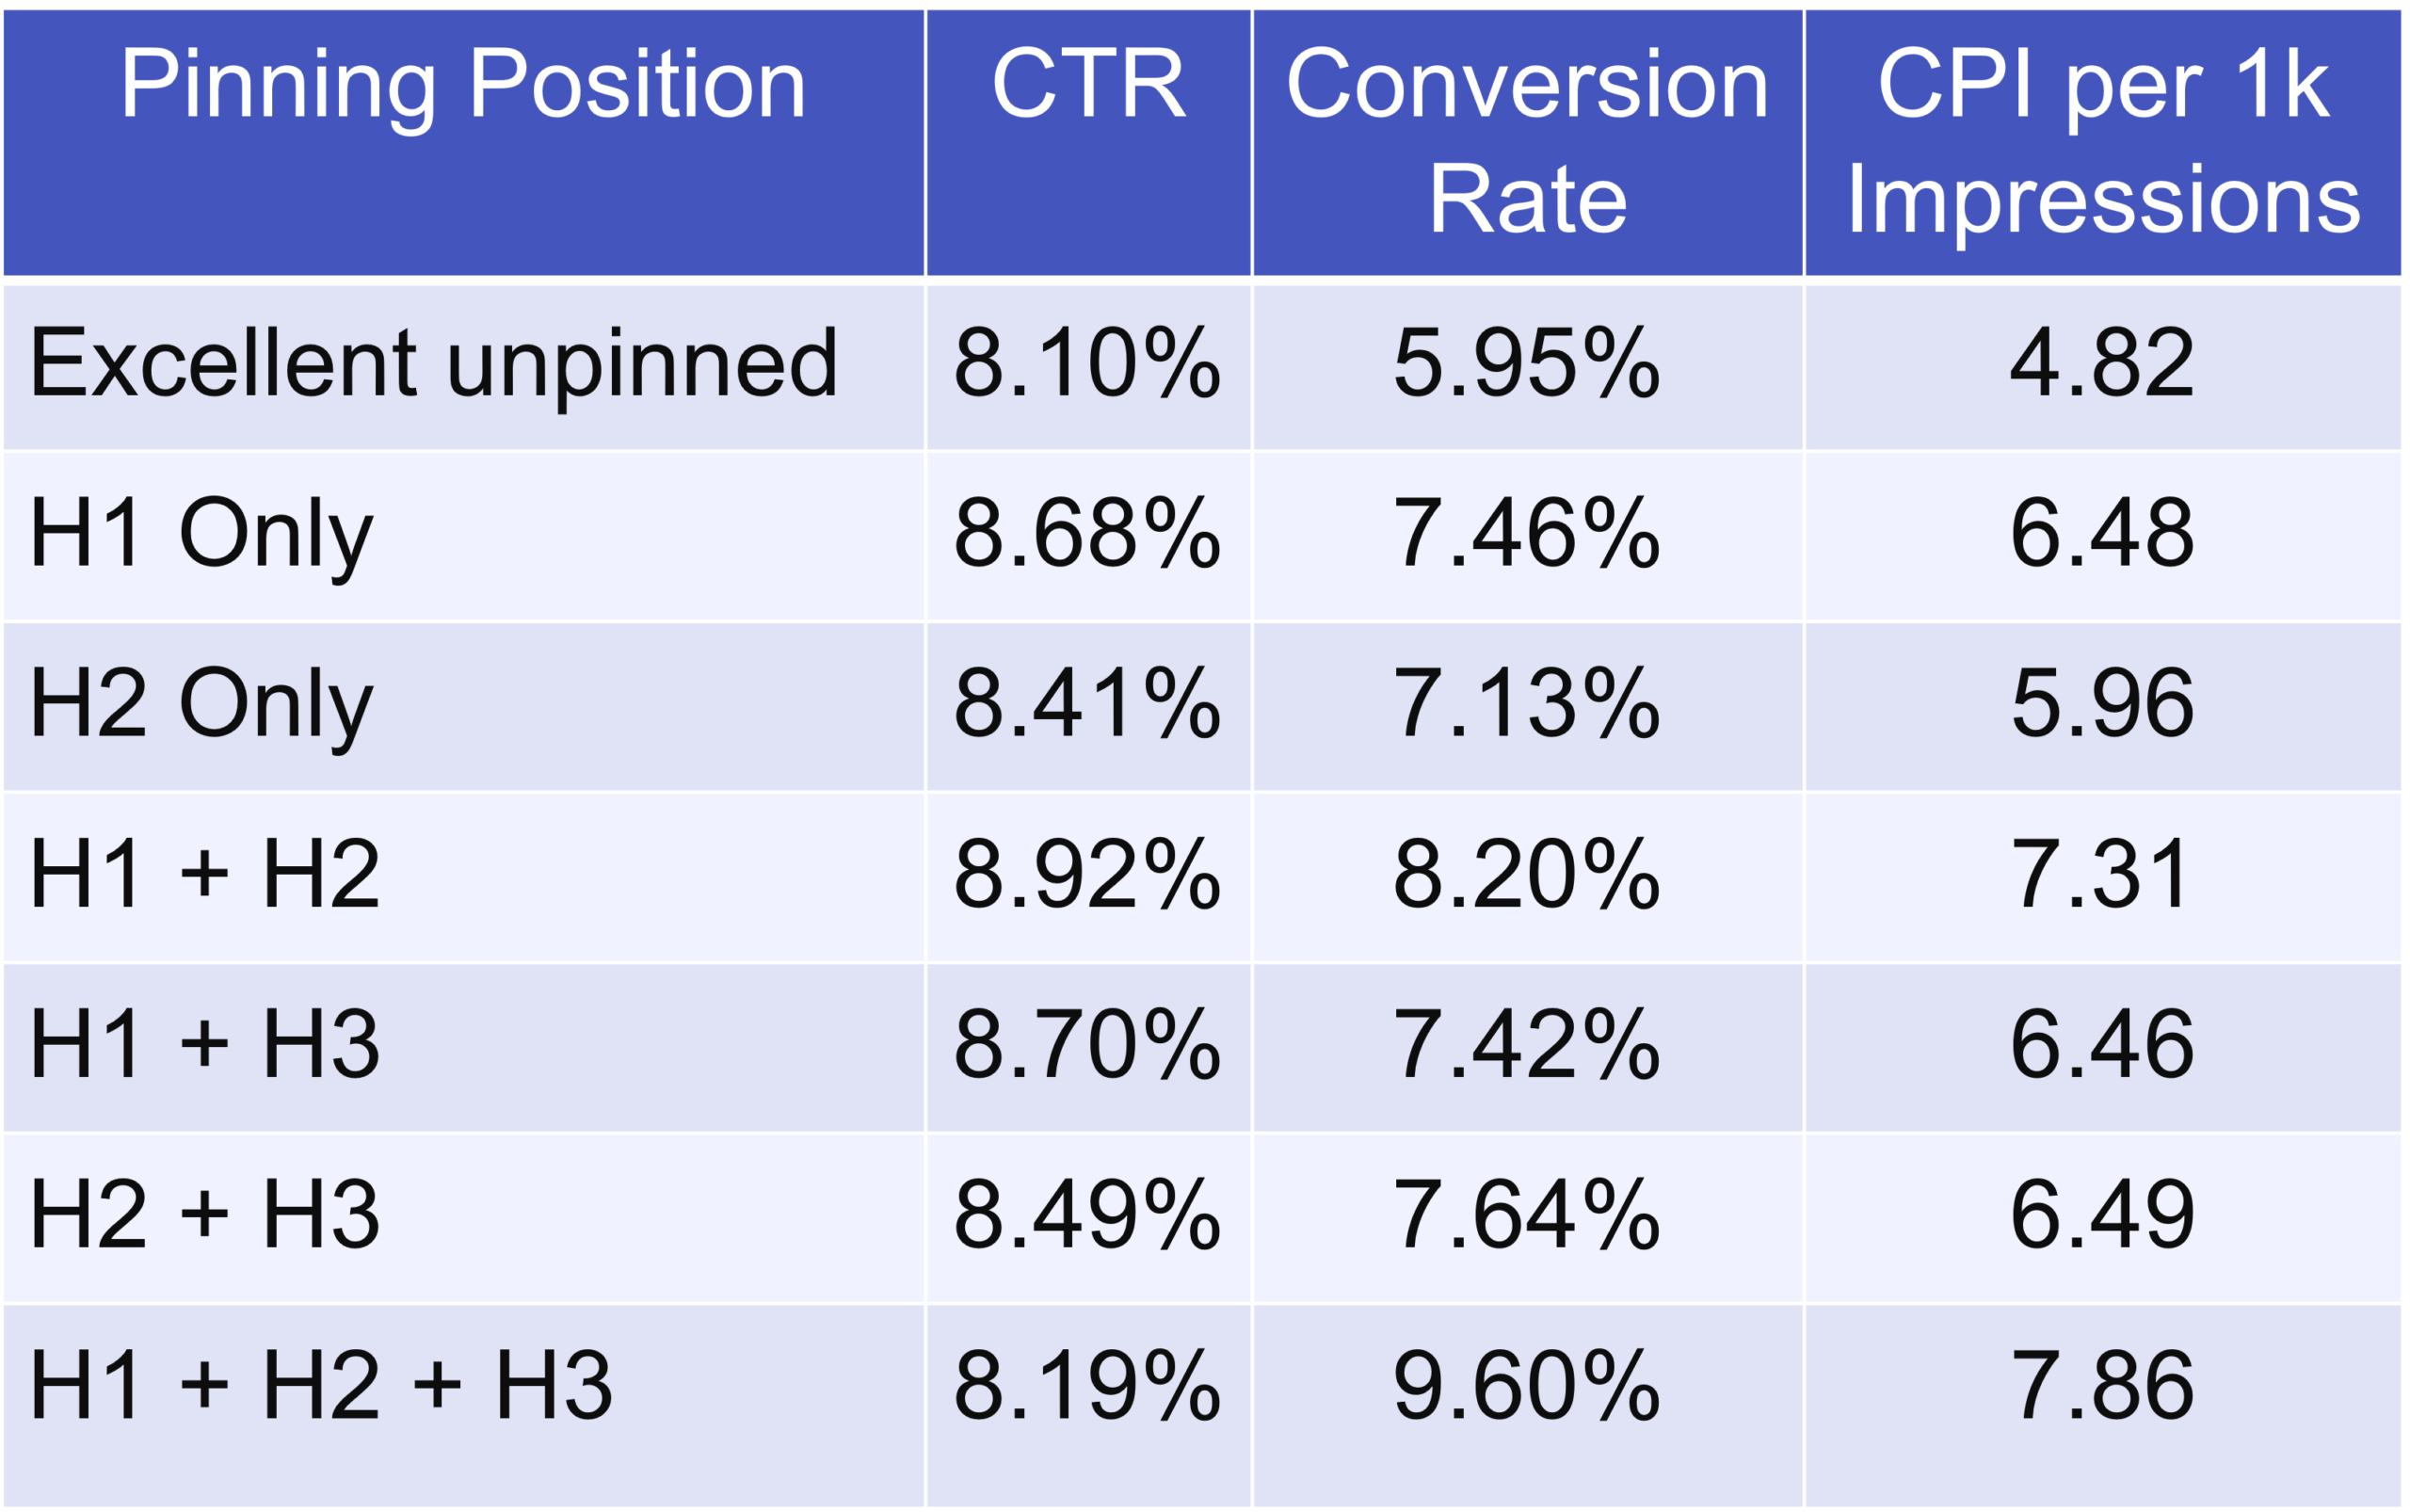
With Good ad strength, CTRs barely change, but conversion rates rise as more headlines are pinned. Pinning headline 3 makes the smallest impact, since it rarely shows.
Interestingly, the highest conversion rates came from fully pinned ads rated Poor. These ads had a single headline pinned to each position.
Unweighted ad strength data when all headlines are pinned
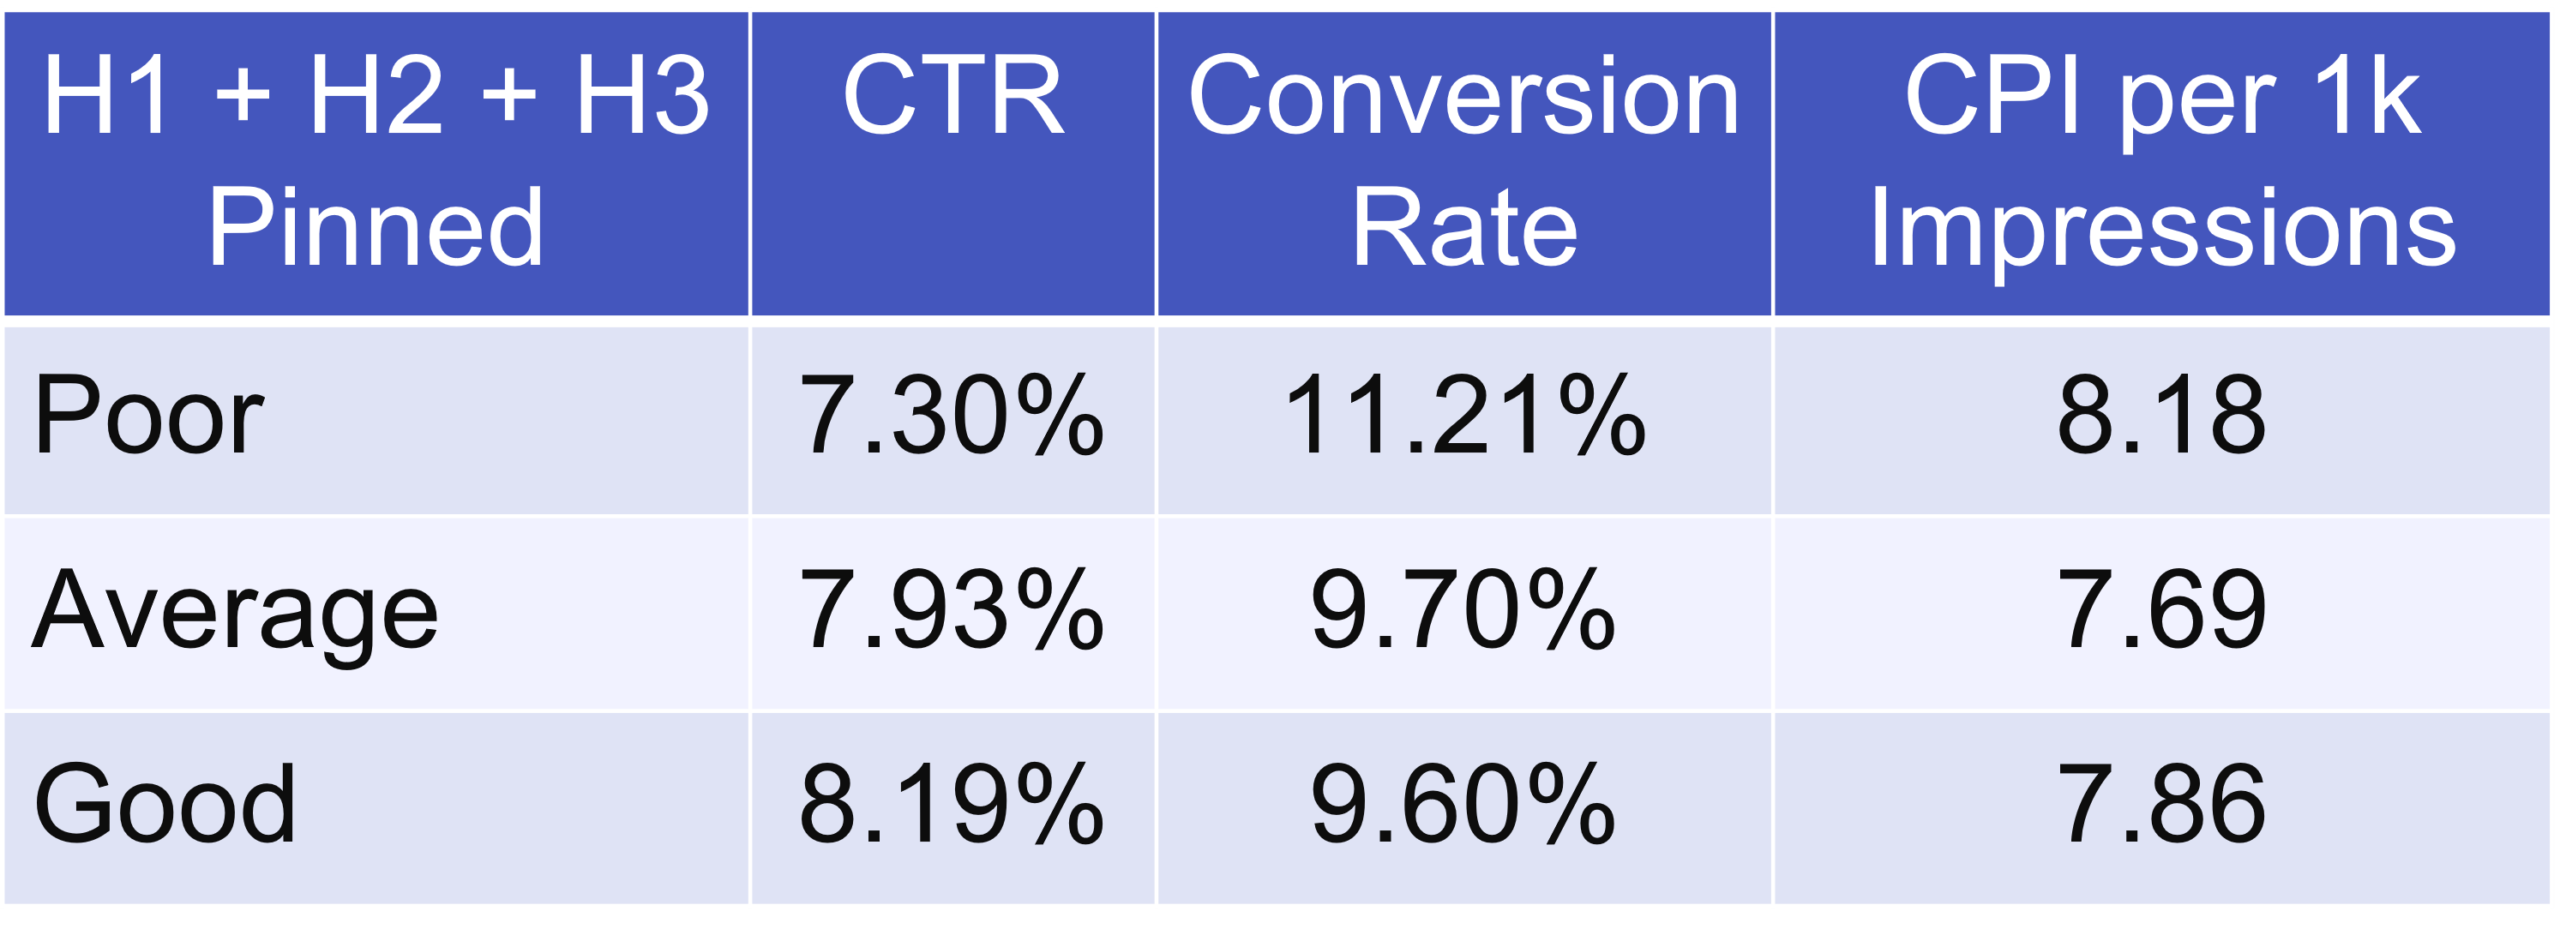
Higher ad strength improved CPI for every pinning combination except ads that pin every headline. Our pinning study found that advertisers who pin every line tend to be the most active ad testers. So their strong results are more likely due to rigorous testing than to Poor ad strength.
Higher ad strength ads get more impressions but convert less
To see whether ad strength affects ad serving and performance, we compared ads within the same ad group.
For this part of the study, we refined the data to ad groups with:
- Exactly two RSAs
- RSAs with different ad strengths
- We kept our original criteria: non-brand ads with conversions and a minimum number of impressions
Both ads in each ad group used the exact same targeting methods. We also used an unweighted analysis, so ad groups with millions of impressions don’t skew the data over ad groups with only a few thousand.
Ads with higher ad strength received more impressions in 63% of ad groups
The higher ad strength ad had more impressions in 63% of ad groups. Overall, these ads had 63% more impressions than the lower ad strength ads.
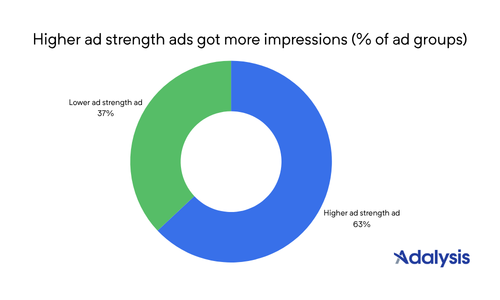
The greater the difference in ad strength, the more often the higher-rated ad received more impressions.
Unweighted data comparing ad strength to impression increases
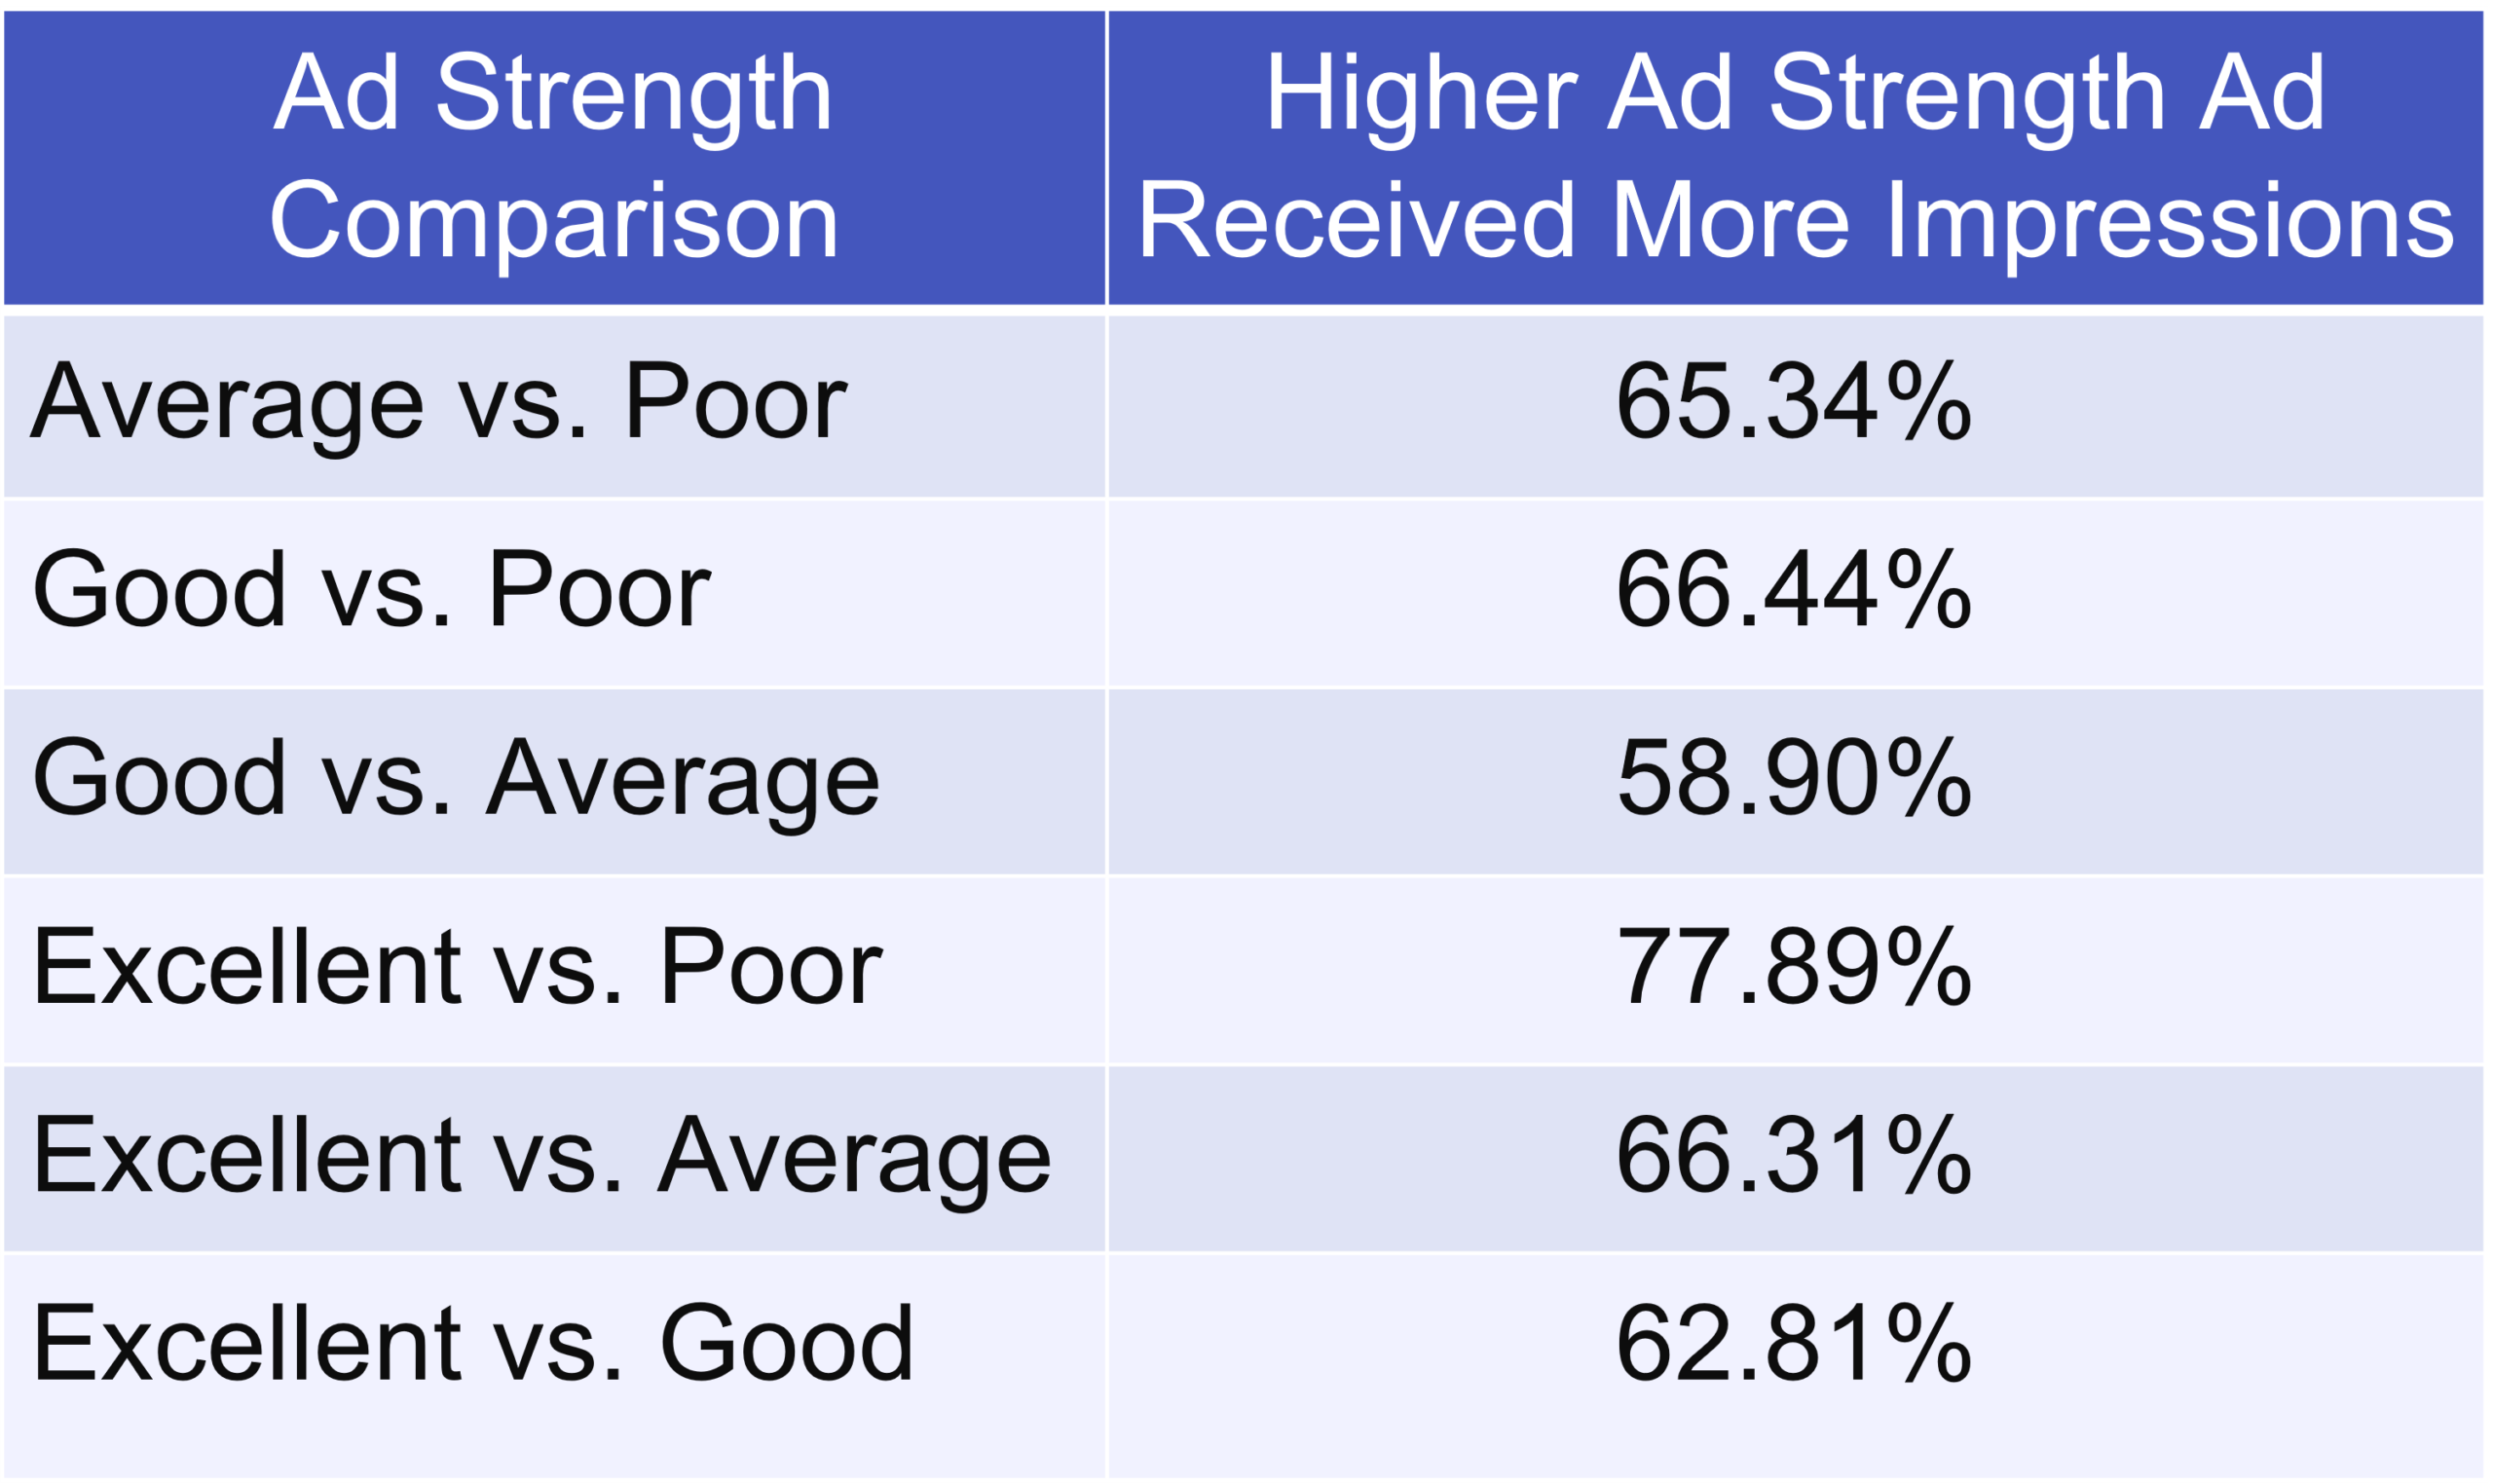
Google consistently favors ads with higher ad strength. The biggest gap was Excellent vs. Poor, where the Excellent ad got more impressions in 78%.
When ads were two ratings apart (Excellent vs. Average, Good vs. Poor), the higher-rated ad got more impressions 66% of the time. The smallest gap was Good vs. Average, at 59%.
For testing, this means the greater the difference in ad strength, the longer it takes to reach statistical significance, since the lower-rated ad gets fewer impressions. Testing a fully pinned Poor ad against an unpinned Excellent ad will take much longer than testing two ads with the same ad strength. Or even a single step in ad strength, such as Average vs. Good.
Adalysis ad testing calculates statistical significance for every RSA test and shows when one ad is getting far fewer impressions than the other, so you know when a result is reliable.
Higher and lower ad strength ads had similar CTRs
In 52% of the ad groups, the higher ad strength ad had a higher CTR than the lower-rated ad.
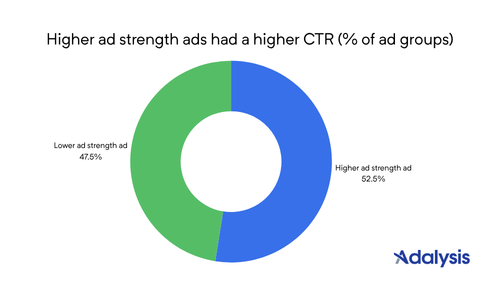
The ads with higher ad strength had a higher CTR 52.5% of the time. However, when looking at the aggregate unweighted data, the ads with lower ad strength actually had a higher CTR.
That means when the higher-rated ad has a higher CTR, it’s not a large increase. When the lower-rated ads had a higher CTR, it’s a much larger difference.
That’s a different picture than looking at CTR by ad strength alone. When we looked at unpinned ads by rating, CTR rose with ad strength. But when two ads share the same targeting, ad strength makes little difference to CTR.
Pinning explains much of this. In most ad groups where the ads have different ad strengths, one ad is pinned and the other isn’t. (There are exceptions, where both ads use pinning or neither does.)
As we saw earlier, pinned ads often have slightly higher CTRs. That’s why the higher-rated ad doesn’t win on CTR as often as you might expect. Either way, the difference within ad groups is small.
Lower ad strength ads had higher conversion rates
In 45% of ad groups, the ads with higher ad strength had a higher conversion rate. That means that the lower-rated ads converted better in most ad groups (55%).
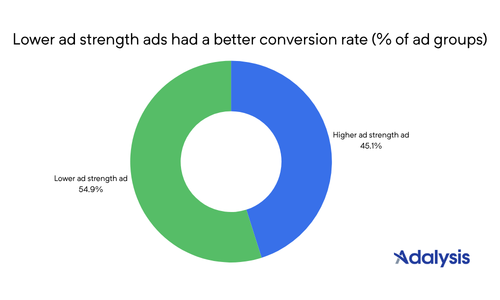
The difference in conversion rates was 9.2%. So if the ad with lower ad strength had a 5% conversion rate, the higher-rated ad was 4.59%.
As with CTR, conversion rates for unpinned ads rise with ad strength. But pinning lowers ad strength and usually increases conversion rates.
The same pattern applies here. Lower-rated ads use more pinning, which is why they often have a higher conversion rate (55% of ad groups).
Lower ad strength ads had higher CPIs more often
The ad with higher ad strength had a higher CPI 45.7% of the time.
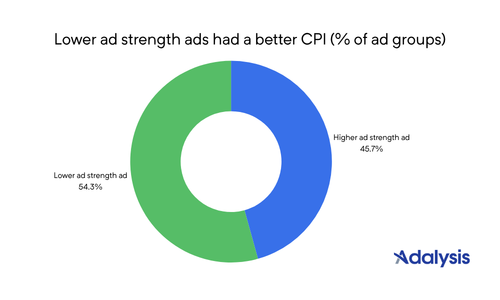
CPI combines CTR and conversion rate. On average, the higher-rated ads had lower CTRs and conversion rates. So in most ad groups (54.3%), the lower-rated ad had the better CPI.
Lower ad strength ads had lower CPAs, often by a wide margin
We didn’t compare CPA or ROAS in the aggregate data. Some ads have CPAs in the thousands of dollars and others in the tens, so neither weighted nor unweighted averages would be meaningful.
Within an ad group, though, both ads share the same targeting and conversion actions. That means we can fairly compare CPAs between ads with different ad strengths.
In 51.5% of ad groups, the ad with the lower ad strength had the lower CPA.
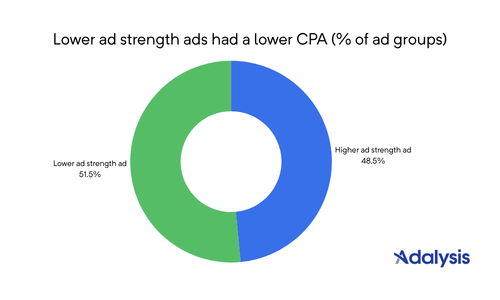
On the surface, the results look close, with each side winning about half the time. But when the lower-rated ad won, it won by a lot. Across all ad groups, the higher ad strength ads had an 11.8% higher CPA. So if a lower-rated ad had a $100 CPA, the higher-rated ad would have $111.80.
Results wrap-up
When two ads in the same ad group have different ad strengths, the higher-rated ads are served more often. The greater the difference in ad strength, the more often this happens.
However, when comparing ads within the same ad group, the lower-rated ads have higher CTRs, conversion rates, CPIs and lower CPAs.
That doesn’t mean you should disregard low ad strength. CTR, conversion rate, and CPI generally rise with ad strength.
Pinning is the main reason why lower-rated ads perform better. Pinned ads tend to have lower ad strength and higher conversion rates.
So if you’re creating unpinned ads, aim for Excellent ad strength.
If you’re testing or pinning ads, it’s fine to have ads with different ad strengths in the same ad group.
Even when you pin, you should focus on raising your ad strength. Pinned ads rated Good generally performed better than Average or Poor.
How to achieve Excellent ad strength
Next, we’ll look at what it takes to reach Excellent ad strength.
The quantity of assets is a large part of ad strength. We wanted to know the minimum number of assets needed to reach each ad strength category.
As pinning can affect your ad strength, we analyzed both pinned and unpinned RSAs.
Unpinned ads: how many assets for Excellent ad strength
The minimum number of headline assets needed rises steadily with each ad strength rating.
Number of headline assets by ad strength
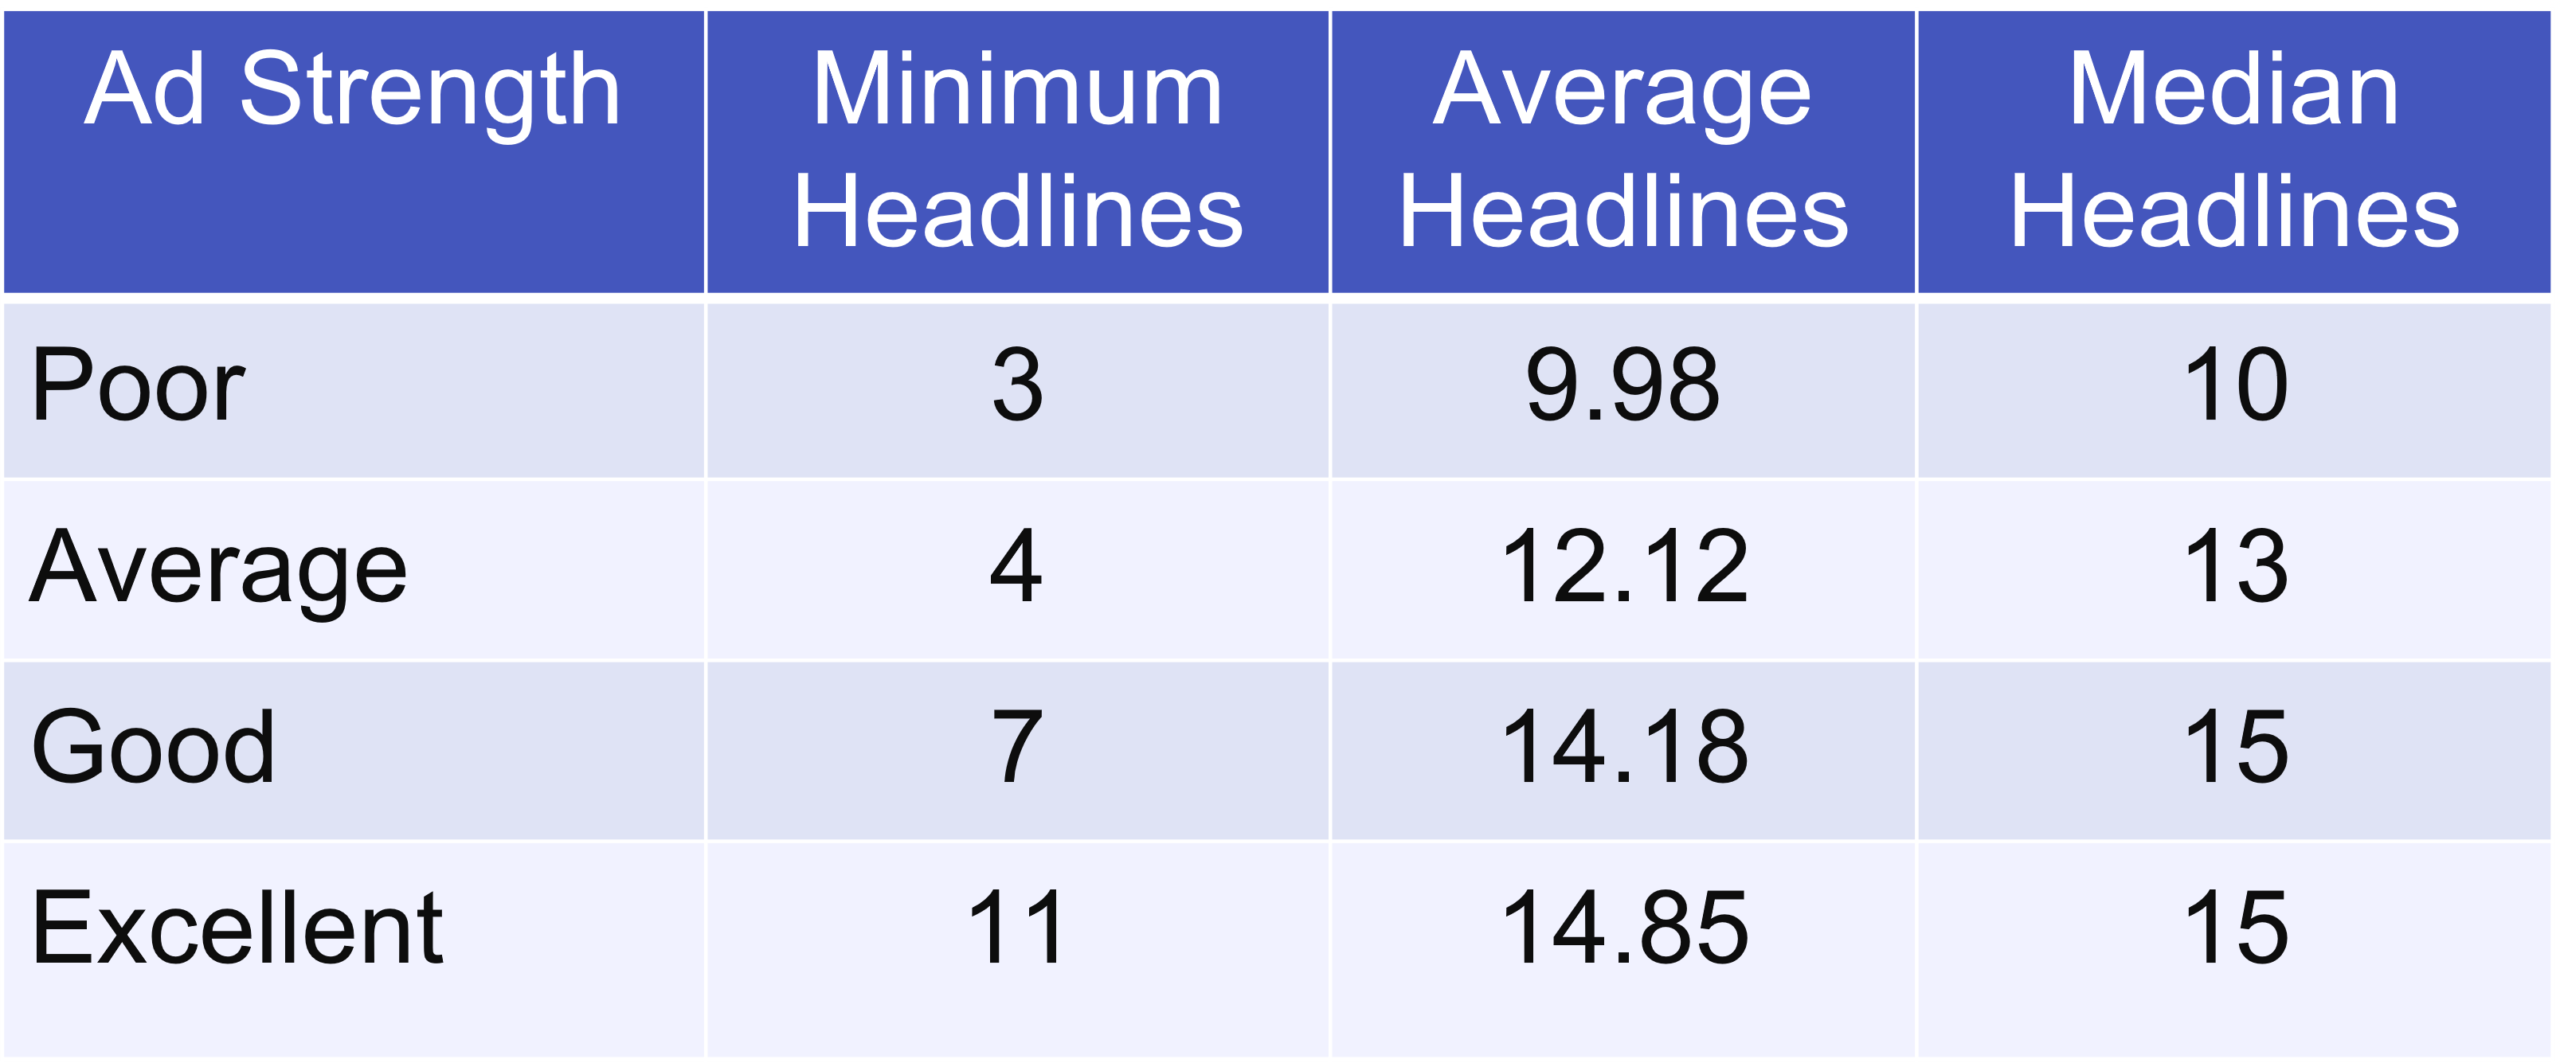
However, asset count isn’t the whole story. Only 44% of ads with 15 or more headlines achieved Excellent ad strength.
This table shows the percentage of ads at each ad strength rating by number of headlines.
Percentage of assets for each ad strength rating
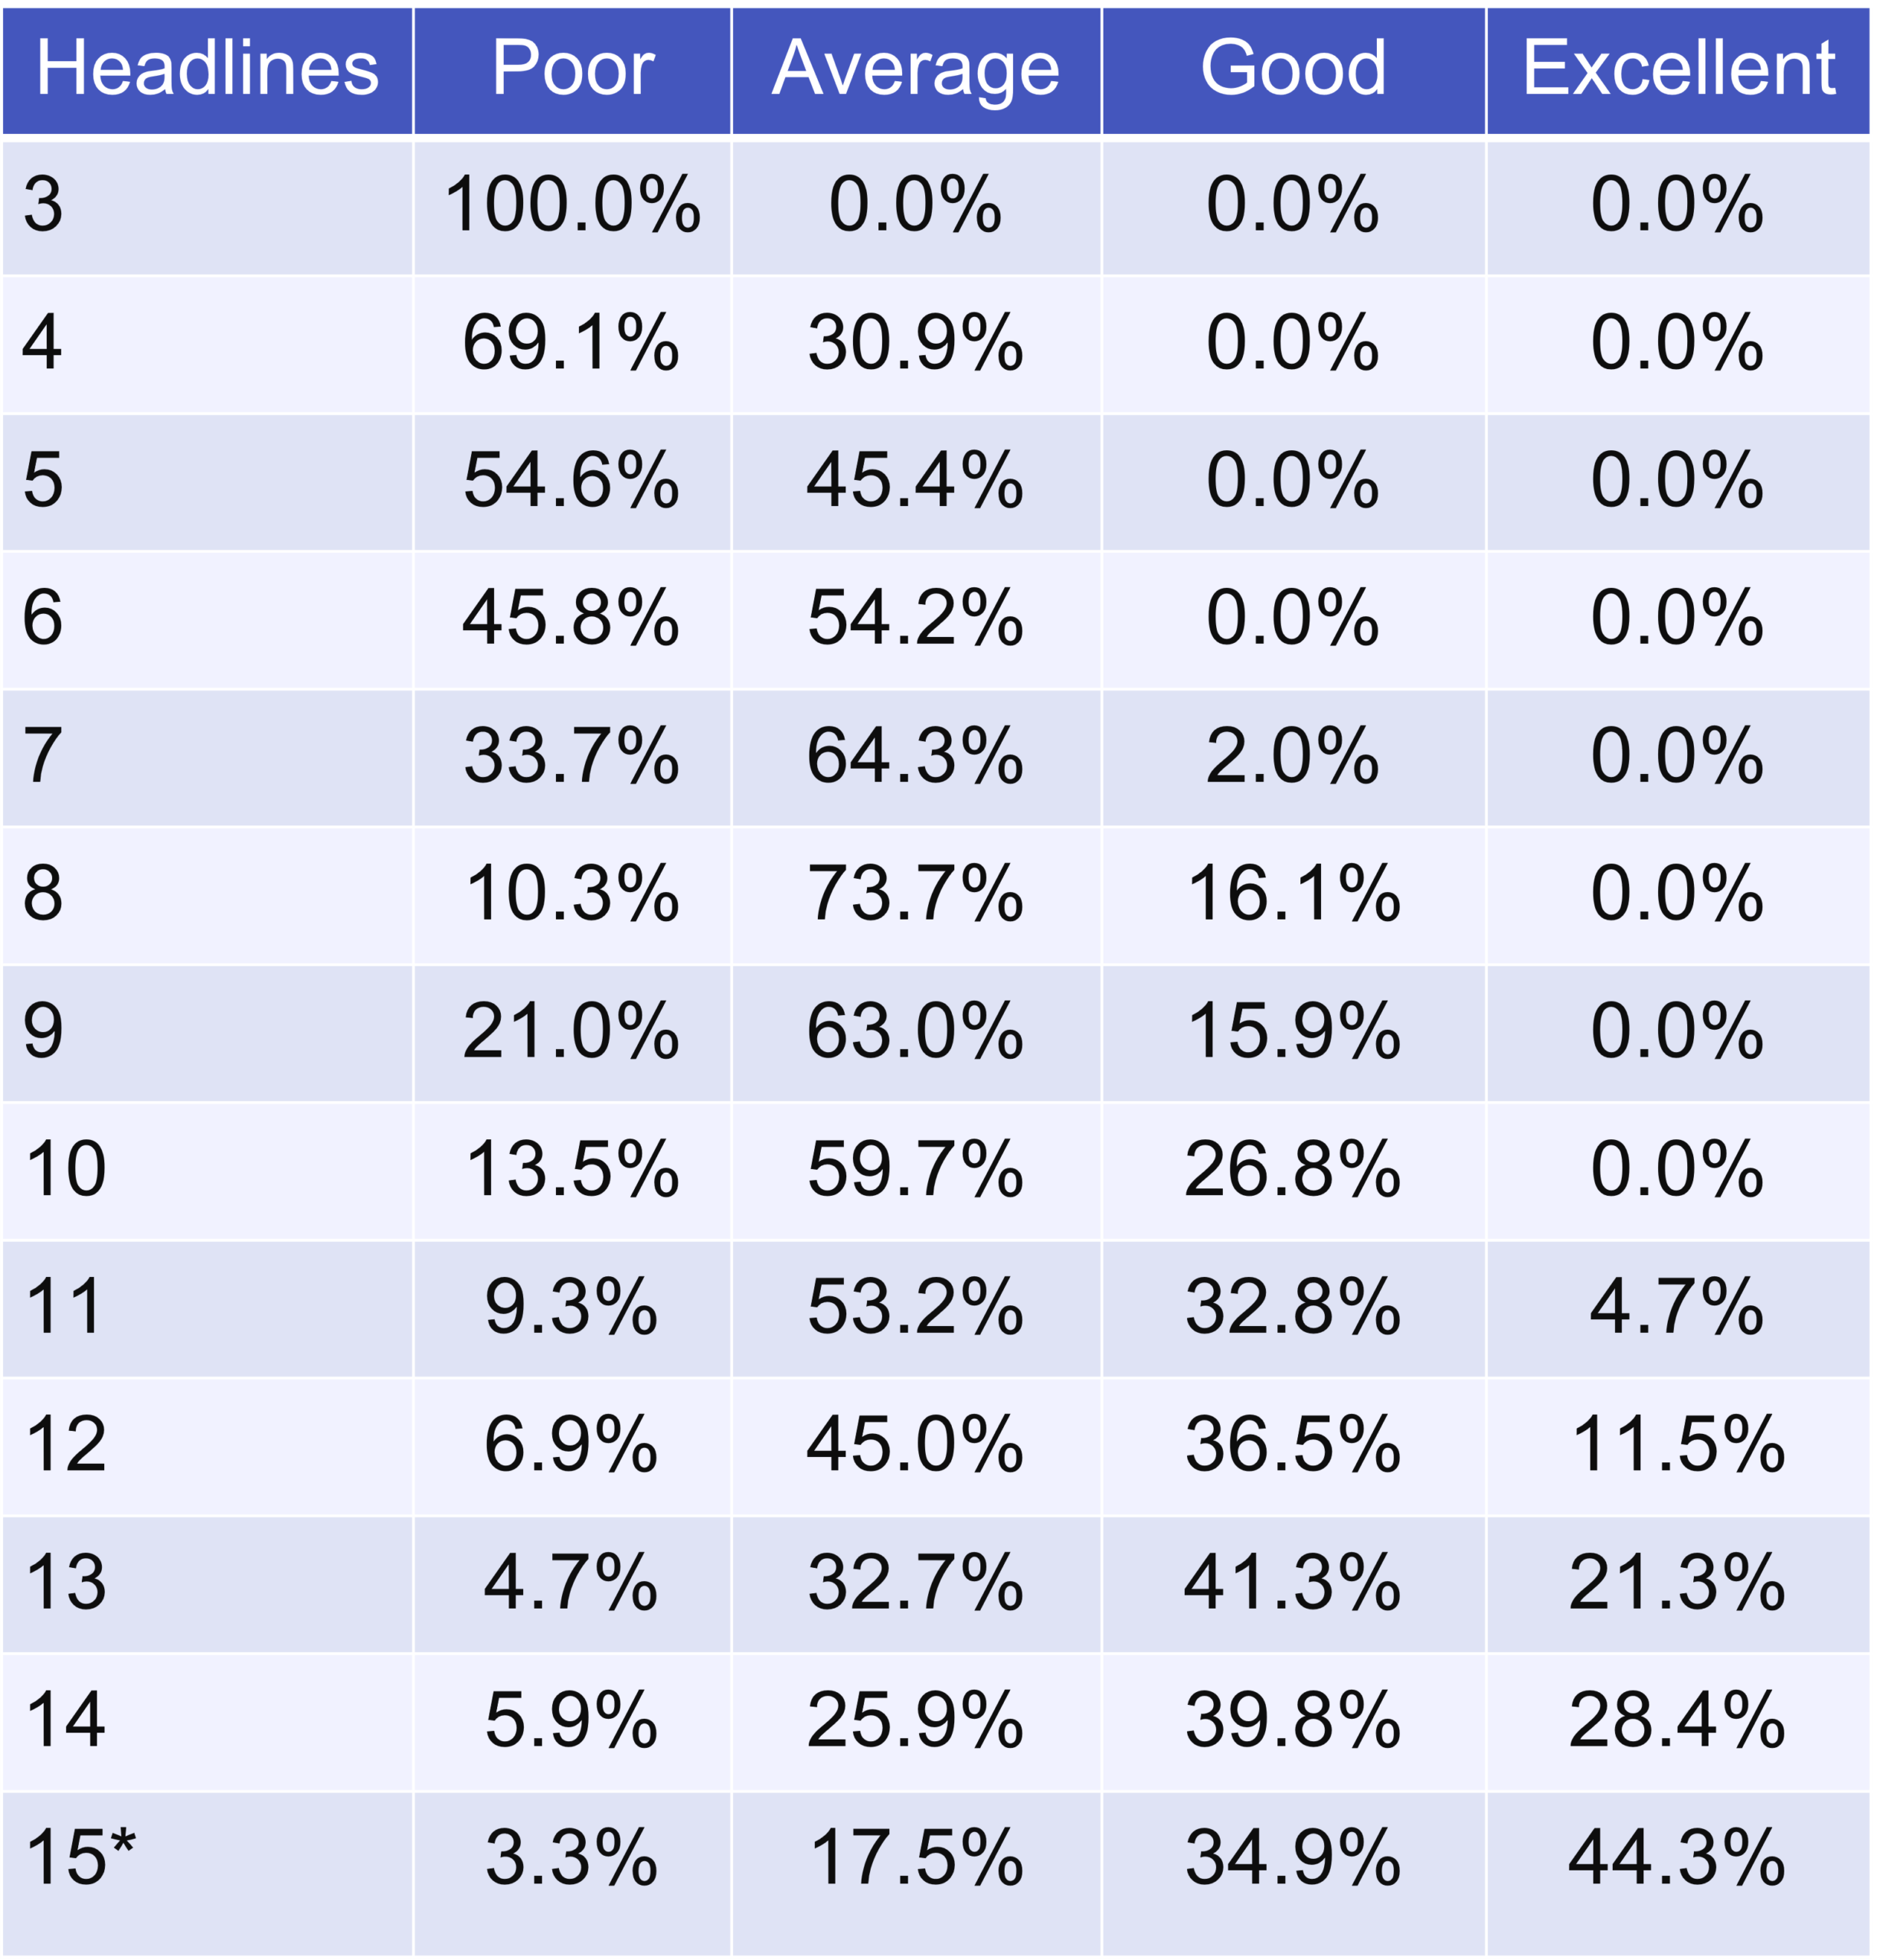
*Some ads have over 15 headlines when auto-created assets are enabled. The most any ad in our study had was 62. To ensure these ads didn’t skew the results, if an ad had more than 15 headlines, we added it to the 15 headline category. These ads made up 7% of the data.
Many ads with more than 15 headlines still had Poor ad strengths. In the most extreme case, an ad with 38 assets was rated Poor. Only 49% of ads with 16 or more headlines reached Excellent.
This also illustrates that turning on auto-created assets won’t necessarily improve your ad strength. You need enough assets to reach Excellent, but the variety of your content matters too.
Our advice for creating unpinned ads
To achieve Excellent ad strength, use at least 11 different headlines. Make sure you’re adding a variety of:
- Keyword-related headlines
- Benefits
- Features
- Calls to action
- Authority statements
Creating a range of assets will help increase your ad strength and satisfy the make your headlines more unique rule.
Follow the other Google recommendations, such as adding sitelinks and descriptions.
How pinning affects ad strength
There are many ways you can pin ads, from pinning a single asset to every headline to pinning 10 assets to a single headline. With so many potential combinations, we need to look at how pinning affects ad strengths from a few angles.
First, we wanted a high-level picture of how many ads fall into each ad strength category, based on how many headlines are pinned.
Percentage of all ads by ad strength
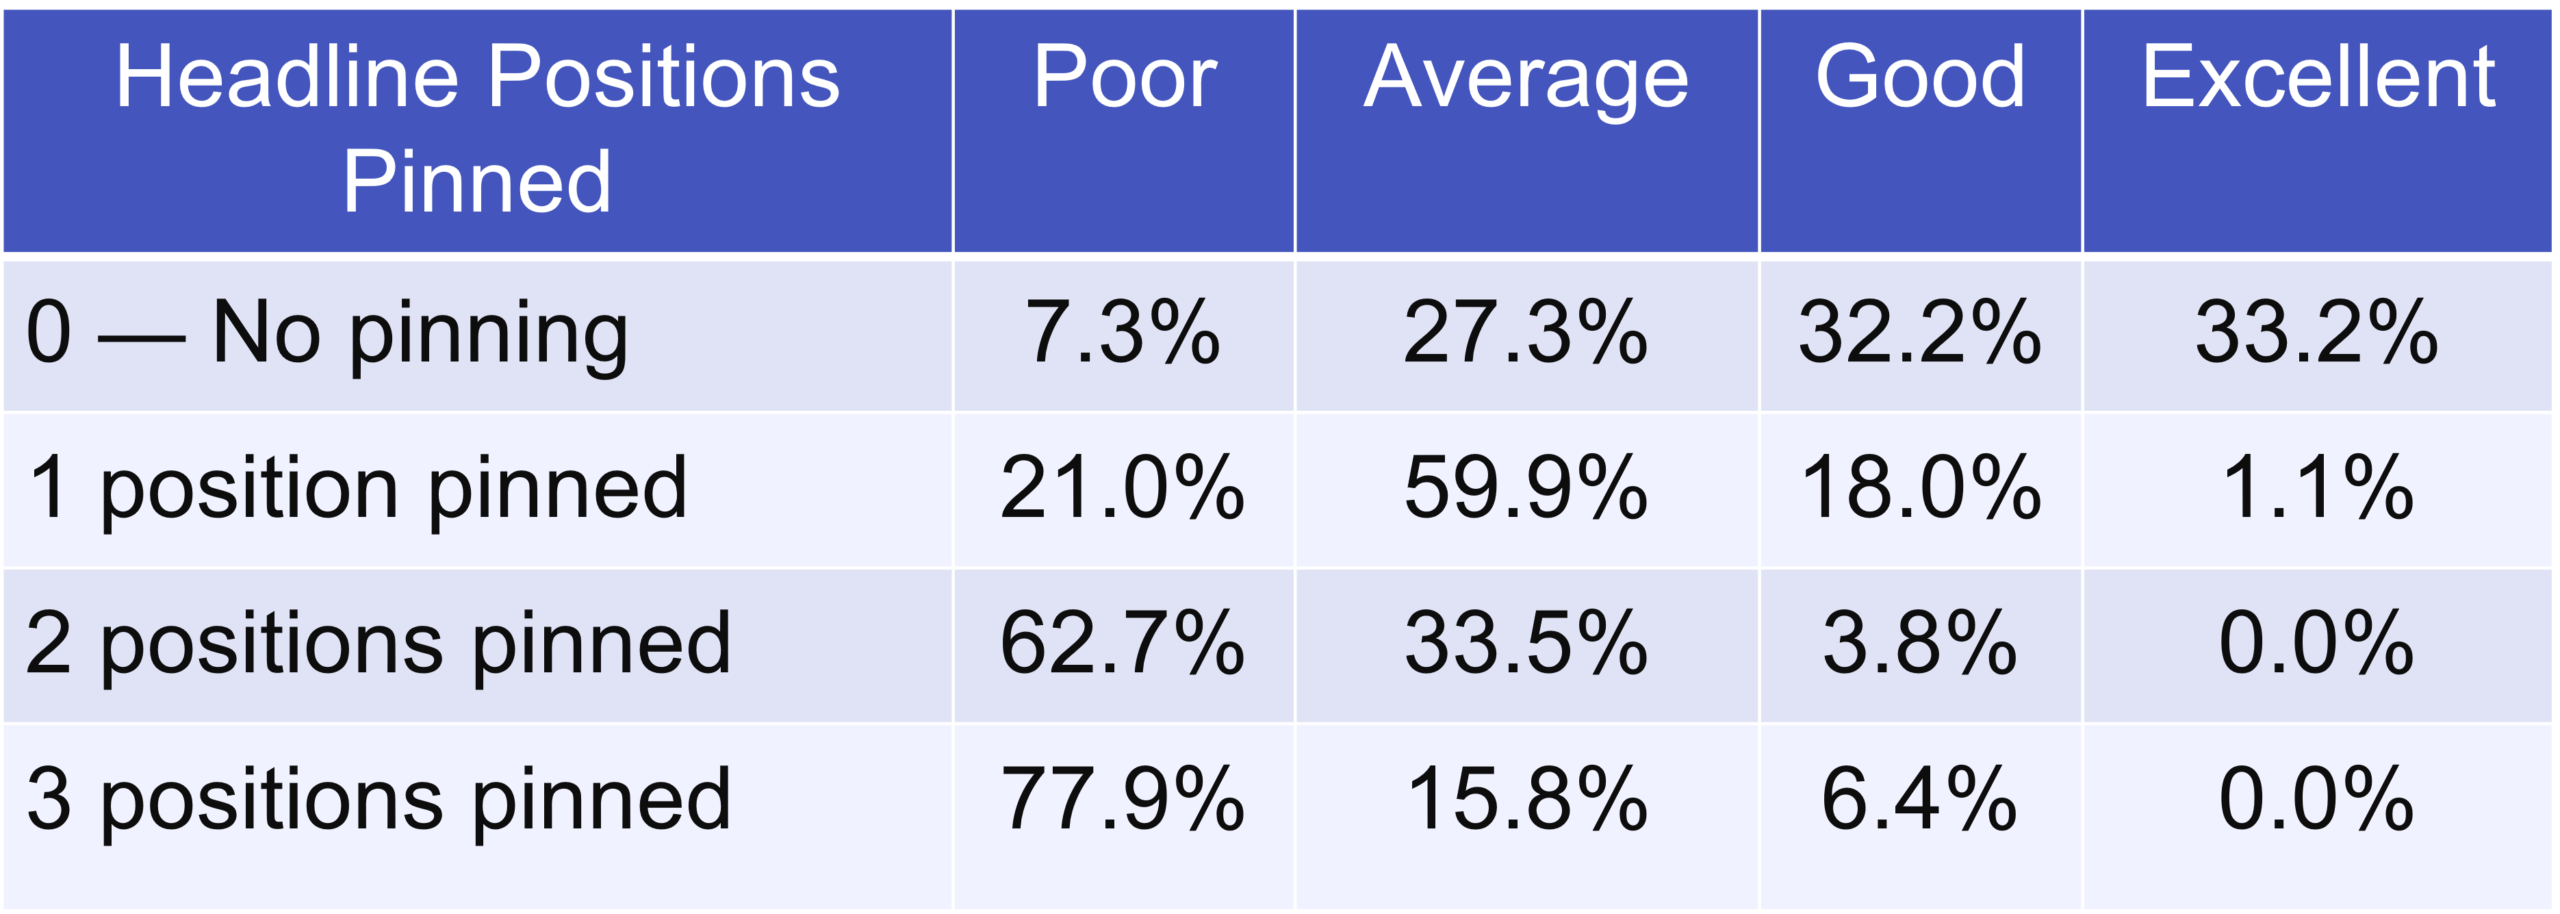
There are three important takeaways from this table:
- If you pin only a single headline, you can still reach Excellent ad strength, but it’s rare.
- If you pin two or more positions, you can’t reach Excellent ad strength.
- The more headlines you pin, the more likely you are to have Poor ad strength.
Notably, advertisers who pin all three headlines are much more likely to manage and act on ad tests than any other group. As a result, fully pinned ads often have slightly better results than other categories. That’s because these advertisers think about and test their ads more, and because of how Google determines ad strength.
Next, we wanted to see the minimum number of assets it takes to reach each ad strength rating when you pin.
Minimum assets for each ad strength category
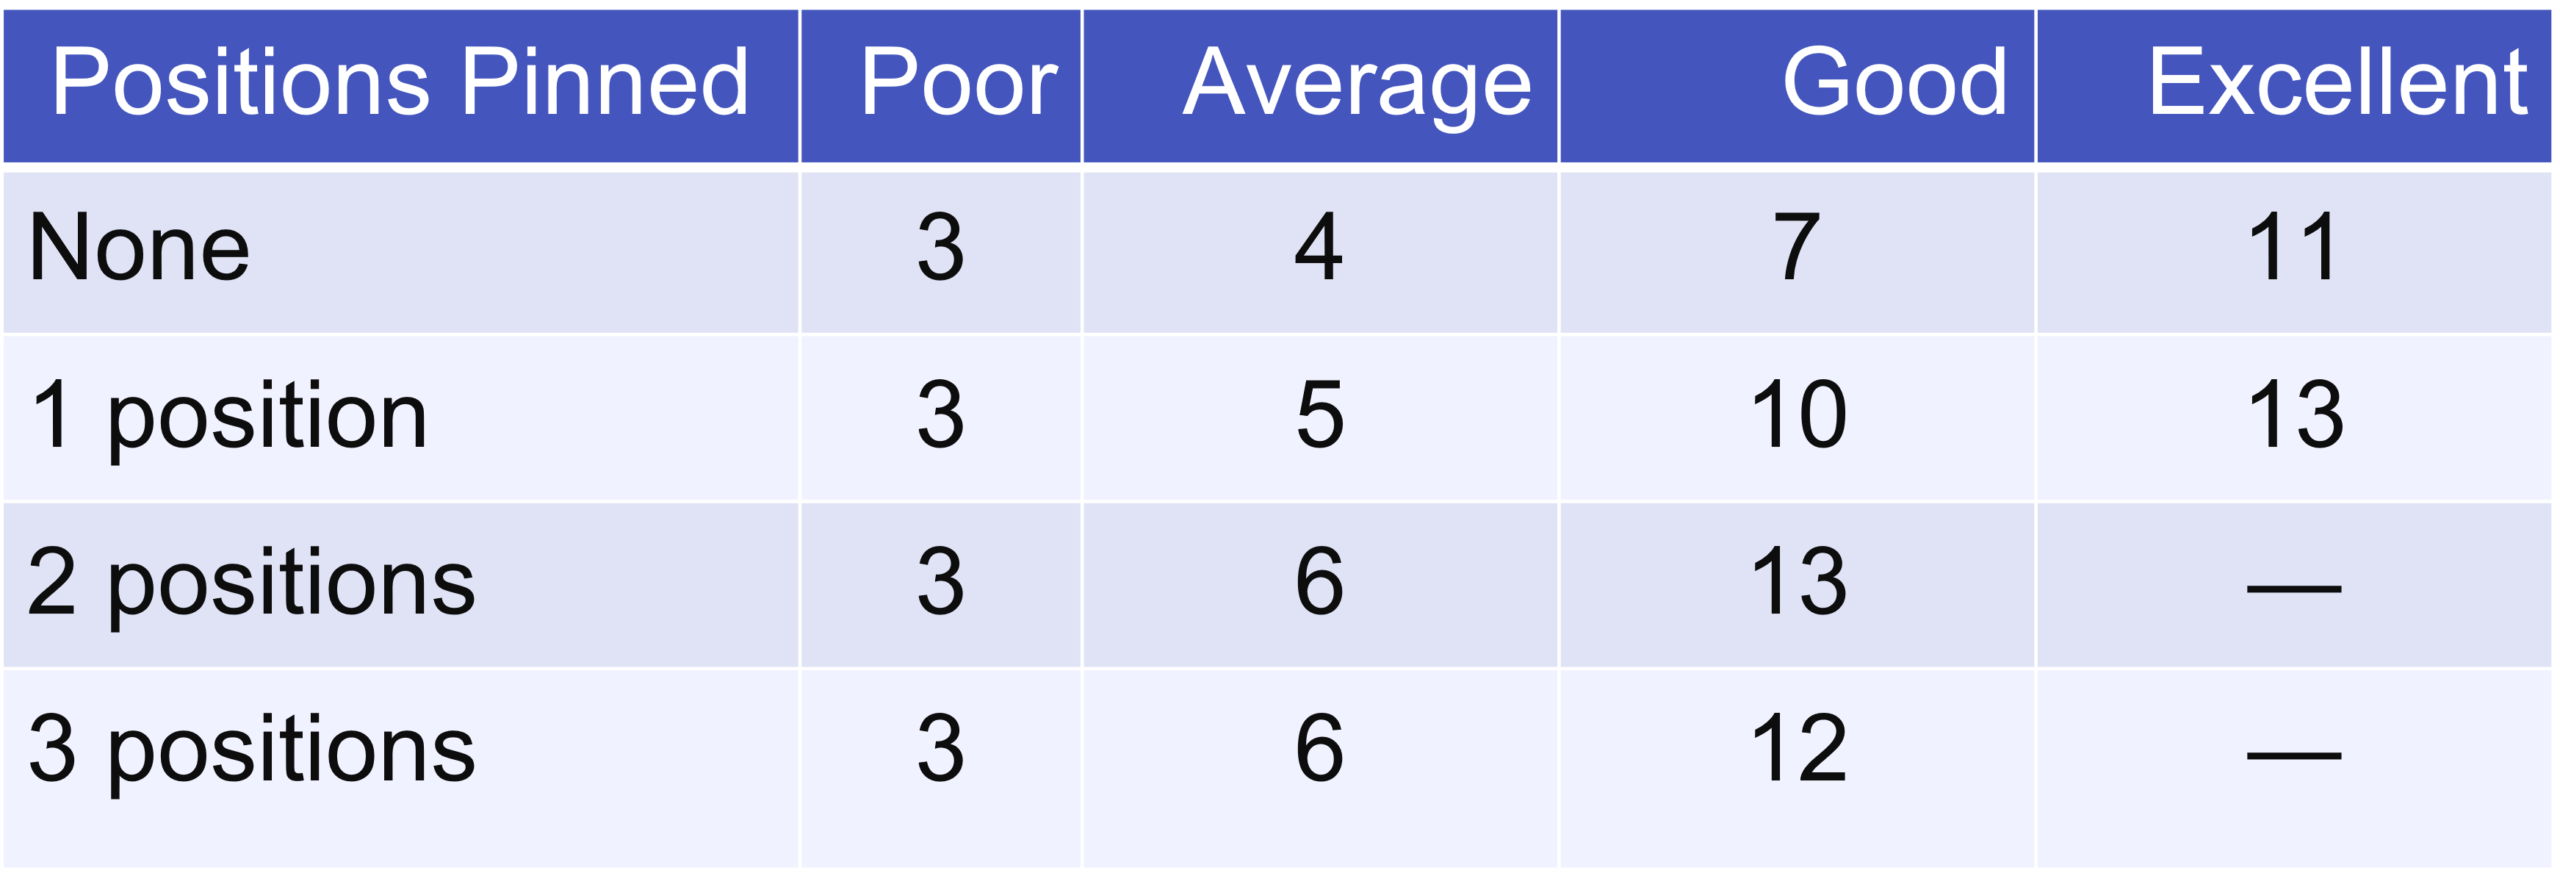
The more you pin, the more assets you generally need to reach each ad strength rating. Without pinning, you can reach Good ad strength with only 7 assets. Once you pin, the minimum jumps to 10.
The exception was ads with 12 assets and three pinned headlines. These ads had multiple ad group-level sitelinks. We don’t know if that helped them reach Good ad strength with fewer assets than ads with two positions pinned. (Many ads with two positions pinned also had ad group-level sitelinks.)
We suspect it was a data anomaly. If you’re pinning all three headlines and want to raise your ad strength, most advertisers should aim for 13 assets.
Our advice for creating pinned ads
When you pin assets, your make your headlines more unique factor will decline. This makes it difficult to see if low ad strength is due to your assets or pinning. That’s why we suggest these steps when creating ads with pinning:
- Remove your pins
- Edit your ads until you have Excellent ad strength
- Pin your assets
- If your ad strength isn’t at least Average (or Good if you’re only pinning a single headline), edit your assets until your ad strength improves.
How pinning multiple assets to one headline affects ad strength
We wanted to see if pinning multiple assets to a headline affects ad strength. Pinning multiple assets decreases the ad strength factor make your assets more unique.
Percentage of ads by the number of assets pinned to each position
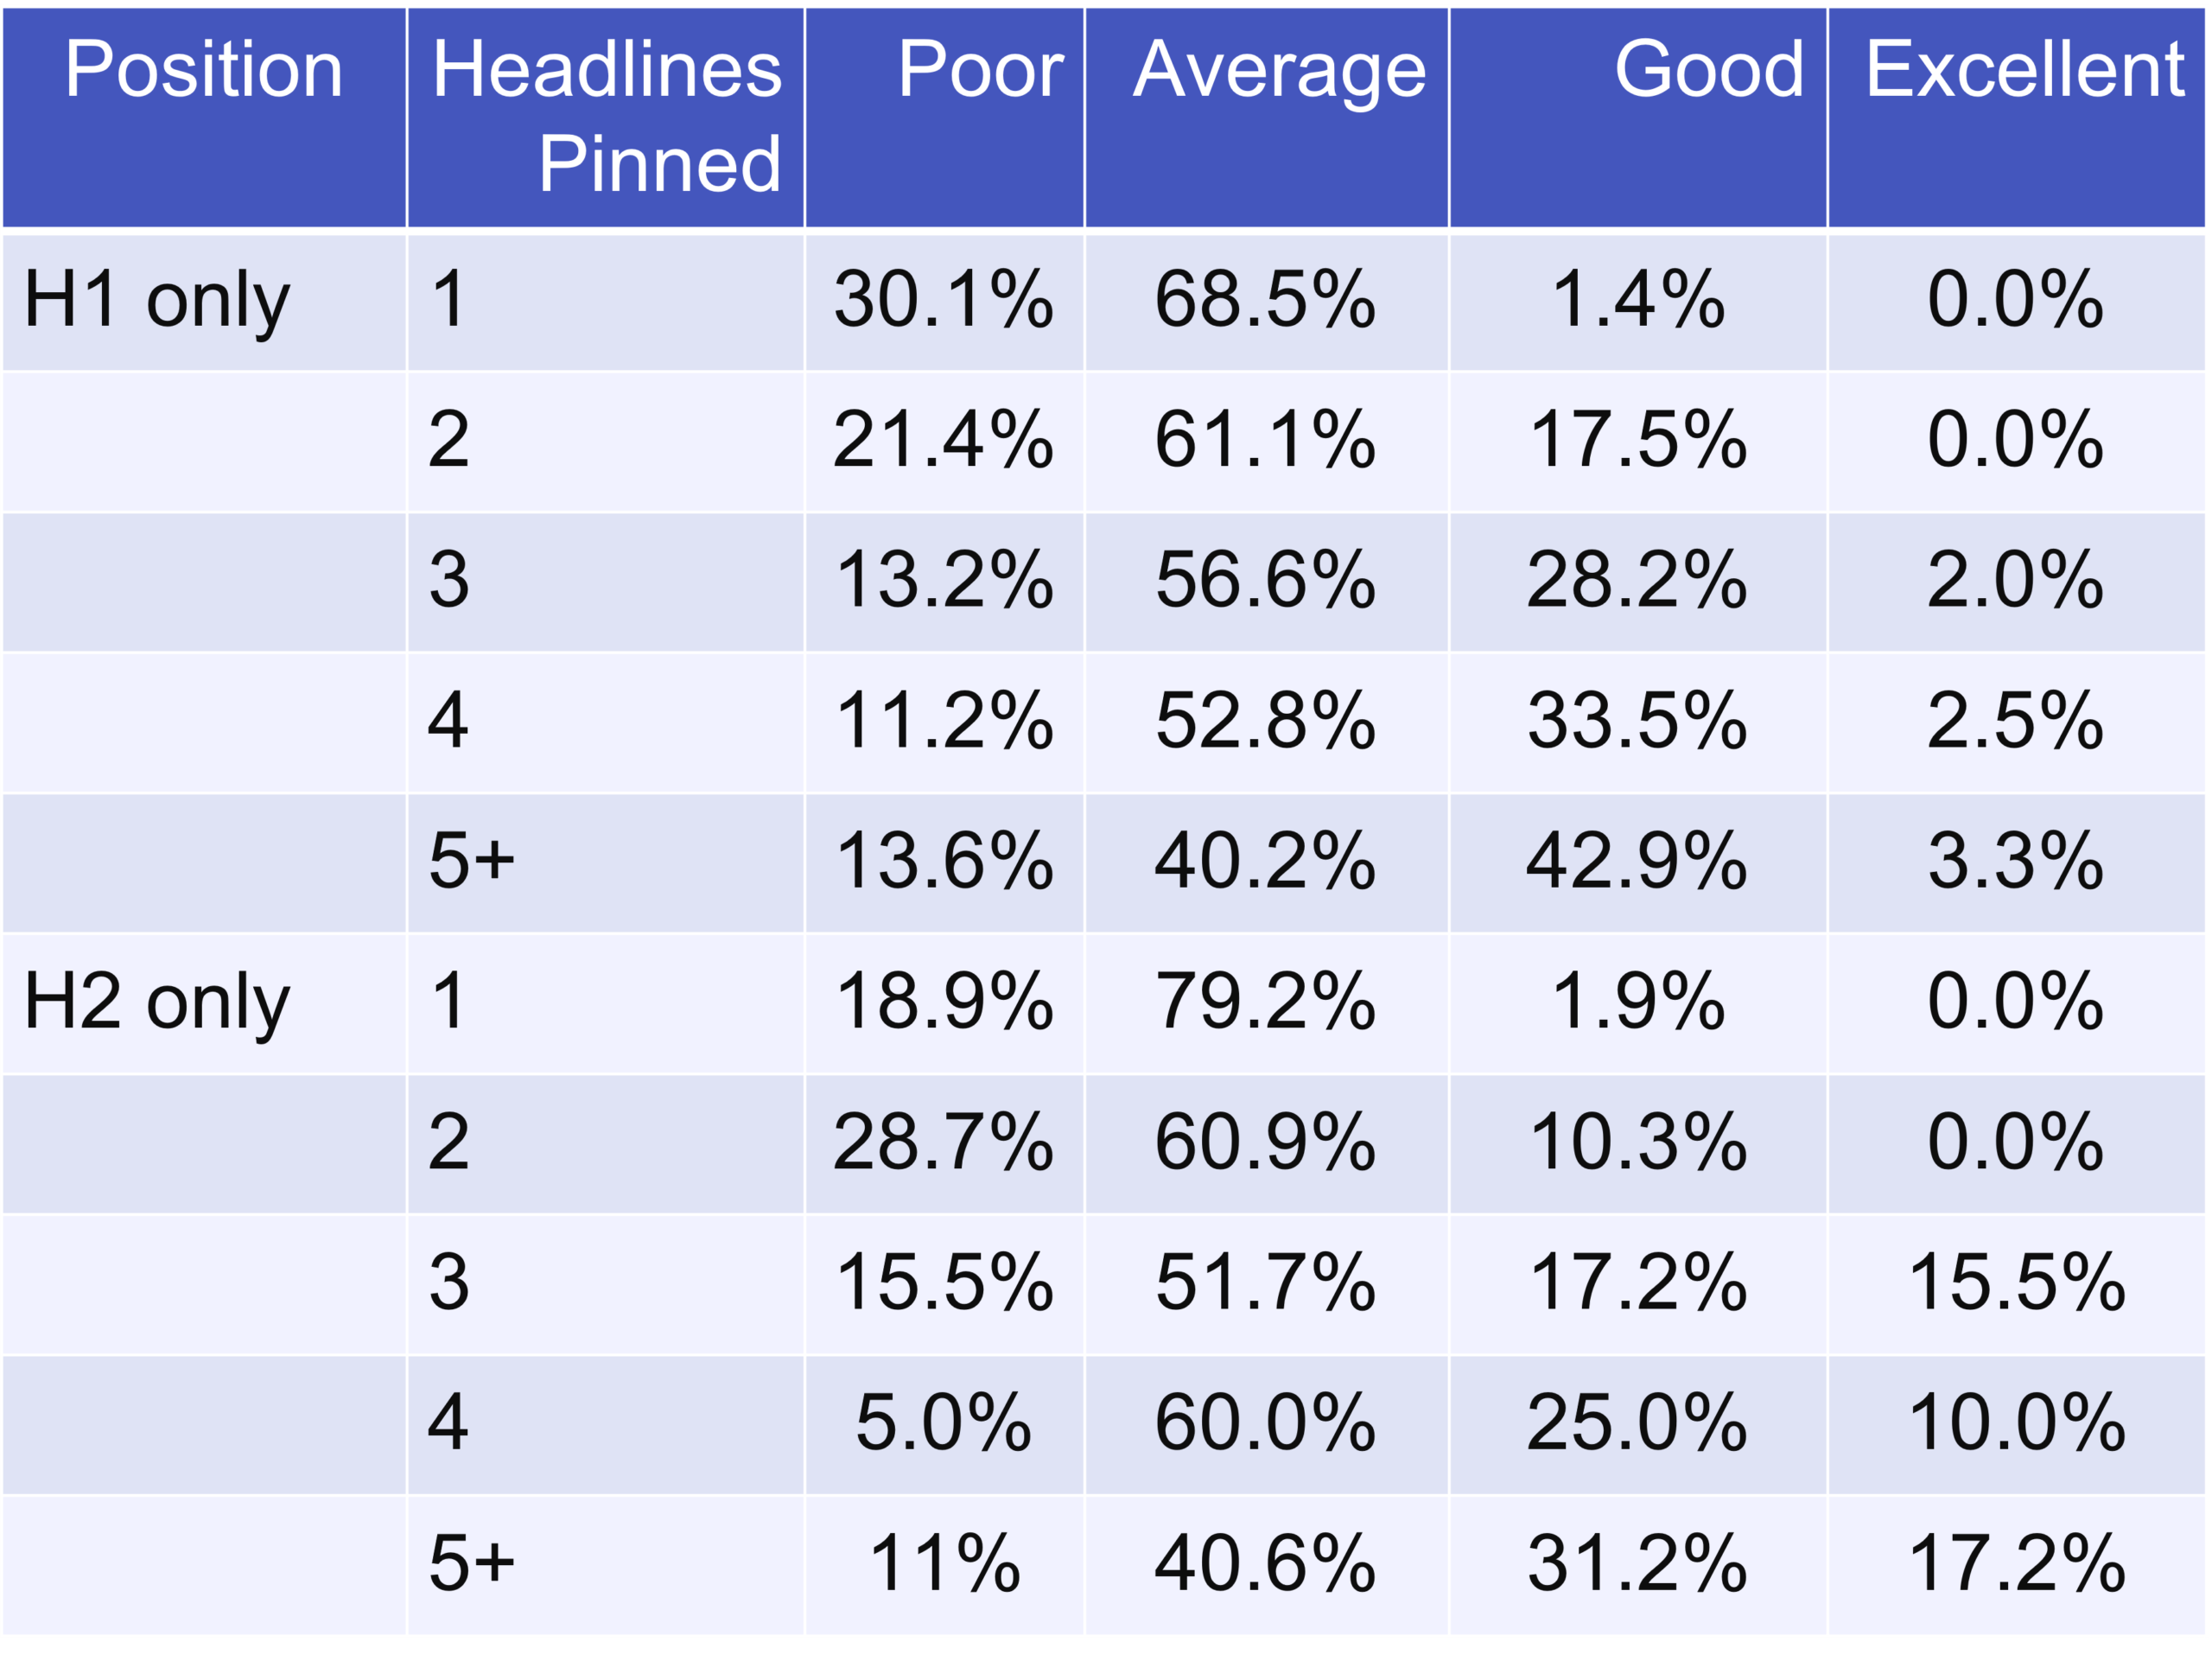
If you pin three or more assets to a single headline, you can still achieve Excellent ad strength. If you only pin one or two, then you’re capped at Good.
A pattern also emerges: Google places more emphasis on headline 1 than headline 2. It’s much easier to achieve Excellent ad strength when you pin assets to headline 2 rather than headline 1.
We broke this data down into each possible pinning combination, from 0-5 assets in each of headline positions 1, 2, and 3. With more than 200 possibilities, the tables are hard to display and analyze meaningfully. Instead, here’s a summary:
- With one asset pinned to headline 1 and at least three assets pinned to headline 2, you can achieve Good ad strength, but it’s difficult.
- With one asset pinned to headline 2, and at least three assets pinned to headline 1, you can achieve Good ad strength.
- With at least three assets pinned to headlines 1, 2, and 3, you can reach Good ad strength, but it’s rare.
- With one or two assets pinned to both headlines 1 and 2, you’ll have Poor ad strength.
- Pinning to headline 3 has the smallest effect on ad strength. You can pin a single asset to headline 1 or 2, and a single asset to headline 3 and still get Good ad strength, as long as you have at least 11 other assets.
Google weights headlines differently when you pin. Headline 1 gets the most weight, followed by headline 2, and much less focus on headline 3.
Our advice for creating different types of pinned ads
1) If you’re using a single asset pinned to one headline, the highest ad strength you can achieve is Good, but it’s rare. Most advertisers will find they can only reach Average ad strength.
Create at least 12 other assets with a mixture of benefits, calls to action, authority statements, and so forth.
If you’re pinning multiple assets to one headline, then pinning at least three assets will help you achieve Good ad strength. Create at least 10 other assets.
It’s easier to achieve Good or Excellent ad strength if you pin assets to headline 2 versus headline 1.
2) If you pin two positions, like headlines 1 and 3, or 2 and 3, the advice for pinning a single headline applies. Pinning headline 3 has very little effect on ad strength.
If you pin both headlines 1 and 2, pin at least three assets to one of them. Otherwise, you’ll be capped at Good ad strength. However, you’re likely only reach Average.
Pinning at least three assets to both headlines 1 and 2 will help you reach Good ad strength. You’ll need at least 13 assets in total.
As with every other option, use a mix of headlines: some related to the keyword, plus calls to action, authority statements, and so on.
3) The advice for creating ads with three pinned headlines is the most difficult to give. Higher ad strength corresponds to better performance. However, the best conversion rates were from advertisers with Poor ad strengths that pinned a single asset to each headline.
If you won’t be stringent with your ad testing, pin at least three assets to each headline. Pinning four or five to each can help increase your ad strength. With 13 assets, you can reach Good. However, the vast majority of ads with all three lines pinned had Poor ad strength.
If you follow a testing methodology, it’s fine to pin a single asset to each headline. In this case, you’re on your results rather than ad strength.
Multiple ads per ad group
The cases where lower-rated ads beat higher-rated ones were all in ad groups with multiple ads. And as soon as you have multiple ads in an ad group, you’re testing ads.
With RSAs, most advertisers create a single ad and let Google optimize the results. But in ad groups with multiple ads at different ad strengths, the lower-rated ad performed better, even though it was served less often.
Testing RSAs is a crucial part of PPC optimization. Regardless of your ad strength, there are often better ways to connect with users, and ad testing helps you find them.
Our Ad Testing Guide covers everything you need to know to run ad tests that lead to better results. If you’re running tests across many ad groups, Adalysis finds and evaluates them automatically, including ads that Google is under-serving.
For most ads, higher ad strength means better results, but there are exceptions. Build your ads with ad strength in mind, then test them. It’s the only way to find the messaging that will increase your PPC profits.
Wrap-up
We ran our original analysis of how ad strength affects your campaigns in 2022. That was four years ago, and we expected a lot of changes since Google’s AI has had a lot of time in which to improve.
In both studies, we compared impressions, CTR, and conversion rates for ads with different strengths in the same ad group.
| Ad type | 2022 results | 2026 results |
| Impressions for higher-strength ads | Higher 56.8% of the time | Higher 63% of the time |
| CTR for higher-strength ads | Higher 48.5% of the time | Higher 52.5% of the time |
| Conversion rates for higher-strength ads | Higher 45.8% of the time | Higher 45.1% of the time |
Google has increased how often they show ads with higher ad strength and the correlation between ad strength and CTR. However, Google hasn’t improved how well ad strength relates to conversion rates when choosing which ad to show.
This is something to bear in mind when testing ads. In this example test, the ad with lower ad strength received significantly fewer impressions despite a better CTR, conversion rate, and CPI.
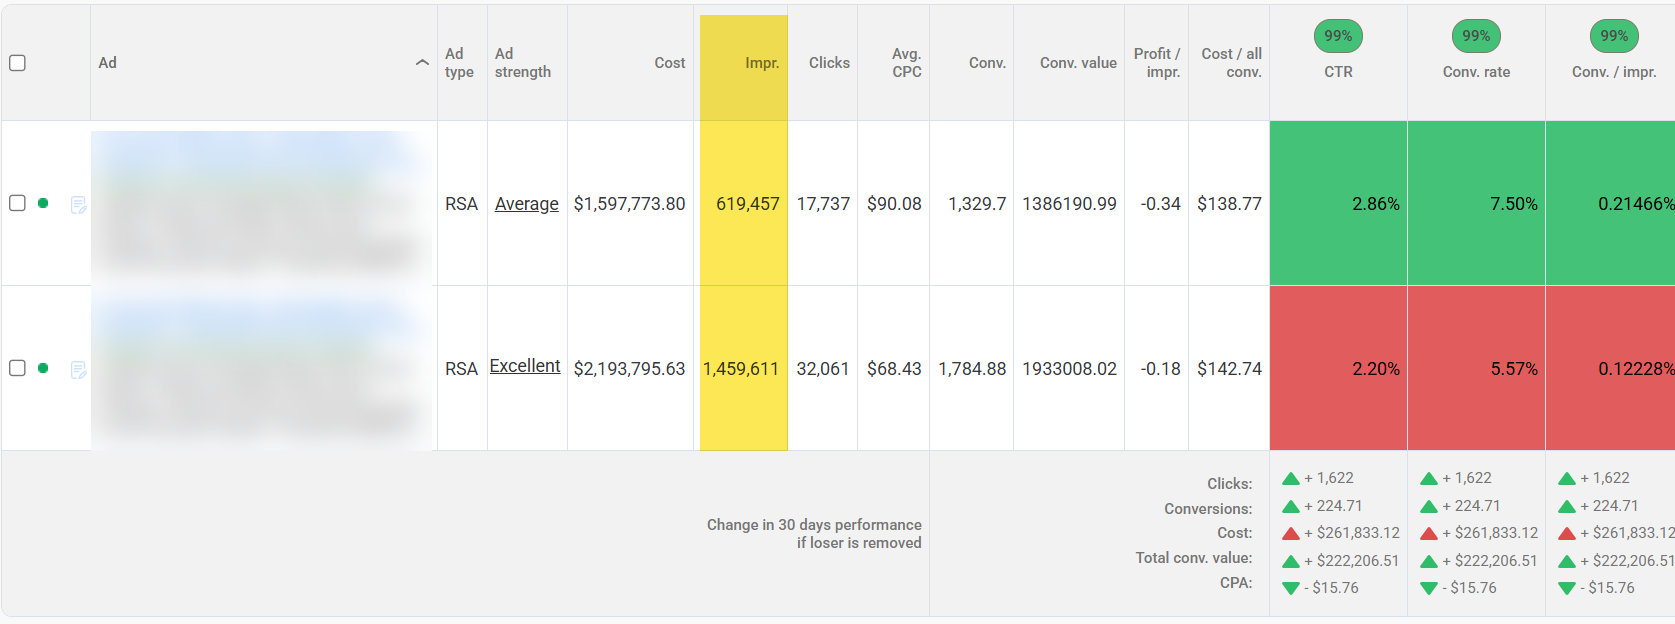
If you’re running tests across many ad groups, Adalysis finds and evaluates them automatically, including ads that Google is under-serving.
In 2022, it was much easier to achieve a Good ad strength or better while pinning assets. That’s no longer the case. As soon as you pin assets to two different headlines, you’re capped at Good, and are likely to get Poor or Average.
We conclude that Google has increased its reliance on ad strength to determine what ad to show in an auction over the years.
However, it’s worth monitoring ad groups with different ad strengths closely. Google will serve the higher-rated ad more often, even if it has a worse conversion rate or CPI.
If you aren’t pinning ads, focusing on a higher ad strength generally leads to better results. As soon as you start pinning, ad strength stops being a good guide for how to build your ads.
While you can use Google’s suggestions to ensure your ads use unique assets, it’s only a guide. Often, the human ability to create compelling ads will outperform the machine’s ability to serve the ads properly.
About the data
At Adalysis, we have a tremendous amount of data. This study is based on over 5,900 accounts that match these criteria. Please note that this is a different data set from the RSA pinning study.
- Ads must be active for at least 30 days.
- Ads must have at least 250 impressions.
- We use weighted and unweighted metrics to compare different search volumes fairly. High-volume ads can have millions of impressions, and they overwhelm thousands of lower-volume ads.
- Ad groups must have at least one conversion so we know the accounts have tracking that works.
- This is a noticeable difference from the RSA study, where each ad must have a conversion.
- Overall, this change lowered CTR, conversion rate, and CPI compared with the previous study.
- Directionally, the data was identical.
- No branded ads.
- No ads with data anomalies (100% conversion rates, CTRs, etc.).
- No campaigns with final URL expansion since that feature can ignore pinning.
Ad strength comparisons
As these metrics directly compare two ads against each other within an ad group, we set additional criteria:
- The ads are in the previous data set and meet the above criteria.
- The ad group has exactly two active RSAs.
- Each RSA has a different ad strength.
Share around the web








Scale your PPC performance,
not your workload.


Leave a comment